

GenogramHow to Make a Genogram: A Beginner's Guide

Ever looked at a genogram and felt overwhelmed? This straightforward guide is designed to help beginners master the basics in six simple steps, whether you're using it professionally or just exploring your own family story, why not give it a try?
What Is A Genogram?
A genogram is like a family tree on steroids – it shows not just who is in the family, but how they’re connected and even how they feel about each other. It looks similar to a basic family tree, but goes much deeper.
For example, a family tree might show that “Annabelle is Blake's mum,” whereas a genogram can show “Annabelle is in recovery from substance abuse and has neglected Blake”.
Getting To Know The Basics
Genograms use a mix of symbols and simple rules to pack a lot of information into a clear, visual format. Some parts are fairly standard - like how to show males, females, or relationships - so that anyone looking at your genogram can understand it easily.
That said, not every symbol or rule is set in stone. Some details vary depending on who’s drawing the genogram, which reference you're using or which tool. The good news? That’s totally fine - as long as you’re consistent. Being consistent means you (or anyone else) can come back to the genogram later - even if it’s for someone you’ve never met - and still make sense of the key information.
How to Start Your Genogram: Pen, Paper, or Online Tools?
You don’t need anything fancy to begin - just a pen and paper will do the trick if you’re starting out or prefer a hands-on approach. But if you’d like a neater, more easily editable version (especially useful for professional settings), there are plenty of online genogram tools available.
Some popular options include:
- GenoPro – a long-standing tool used by many professionals.
- FamilyAxis Genogram Tool – a visually modern option that works well for both personal and professional use.
- Canva – great for visually designing simple genograms or family trees.
- Lucidchart – helpful for creating structured diagrams, including genograms.
- SmartDraw – offers a variety of templates, including genograms and medical diagrams.
Choose whatever suits your workflow best - just make sure it allows you to add symbols clearly and consistently!

How To Make A Genogram:
This 5-step guide will help you build a clear, meaningful genogram - without overwhelming you (hopefully).
Now, grab a cuppa or a “brew” as my Northern friends would say and follow this step-by-step guide:
Step 1 - Gather Information
- Talk to the family or check records. Start by asking about names, birthdays, marriages, divorces, illnesses, and anything else relevant. Think of it as piecing together a family story. Make a list of everyone and their relationships.
- Clarify your purpose. Are you focusing on medical history, social patterns, or something else? Knowing why you’re making the genogram helps guide what details to collect.
Step 2 - Draw the Nodes
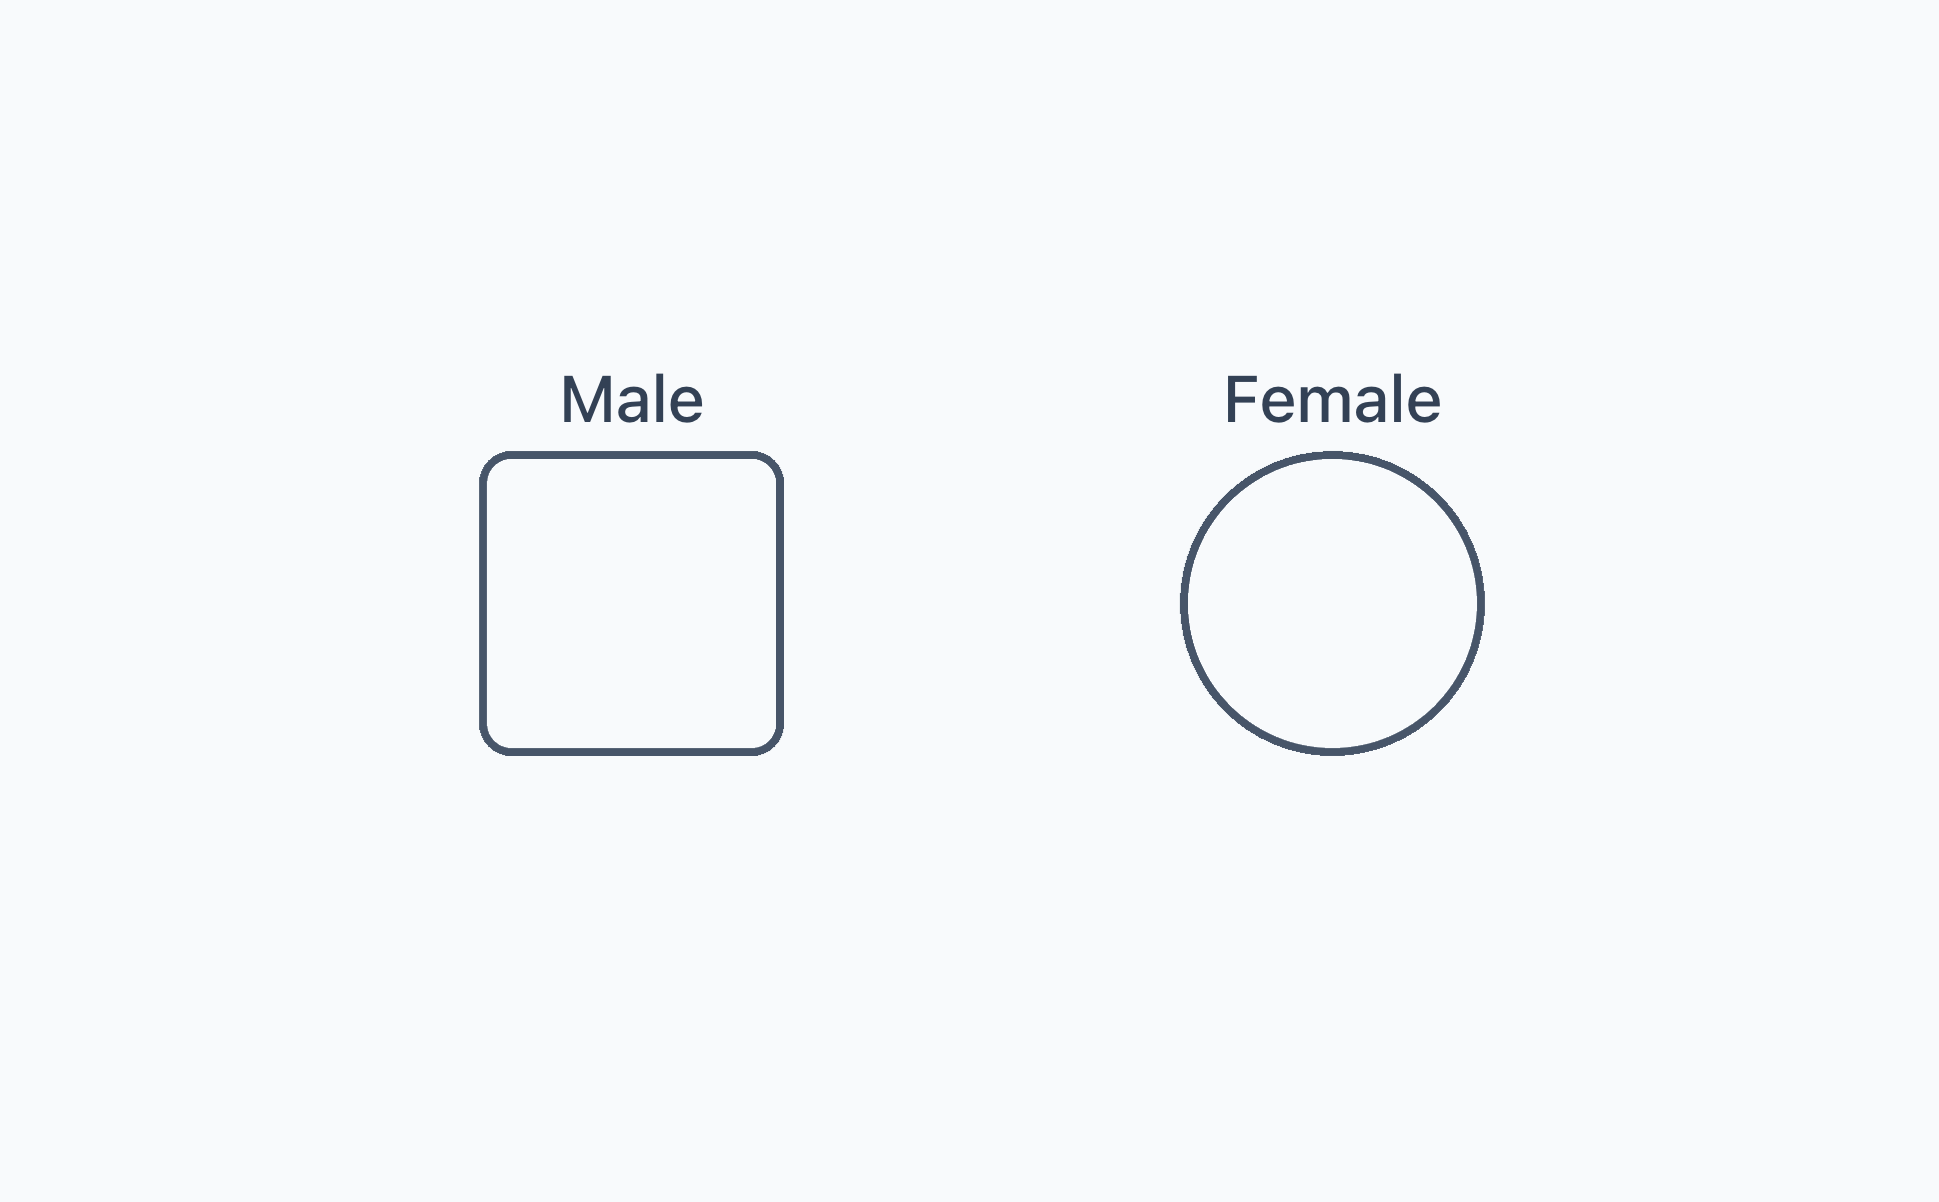
- Gender symbols and placement. In genogram terminology, each person or significant individual is represented by a node: a square for males and a circle for females. For consistency, place each male node to the left of the corresponding female node.
- Representing Gender Diversity
If you or someone in the family doesn’t identify as cisgender, don’t worry - there are clear symbols to reflect gender identity too.
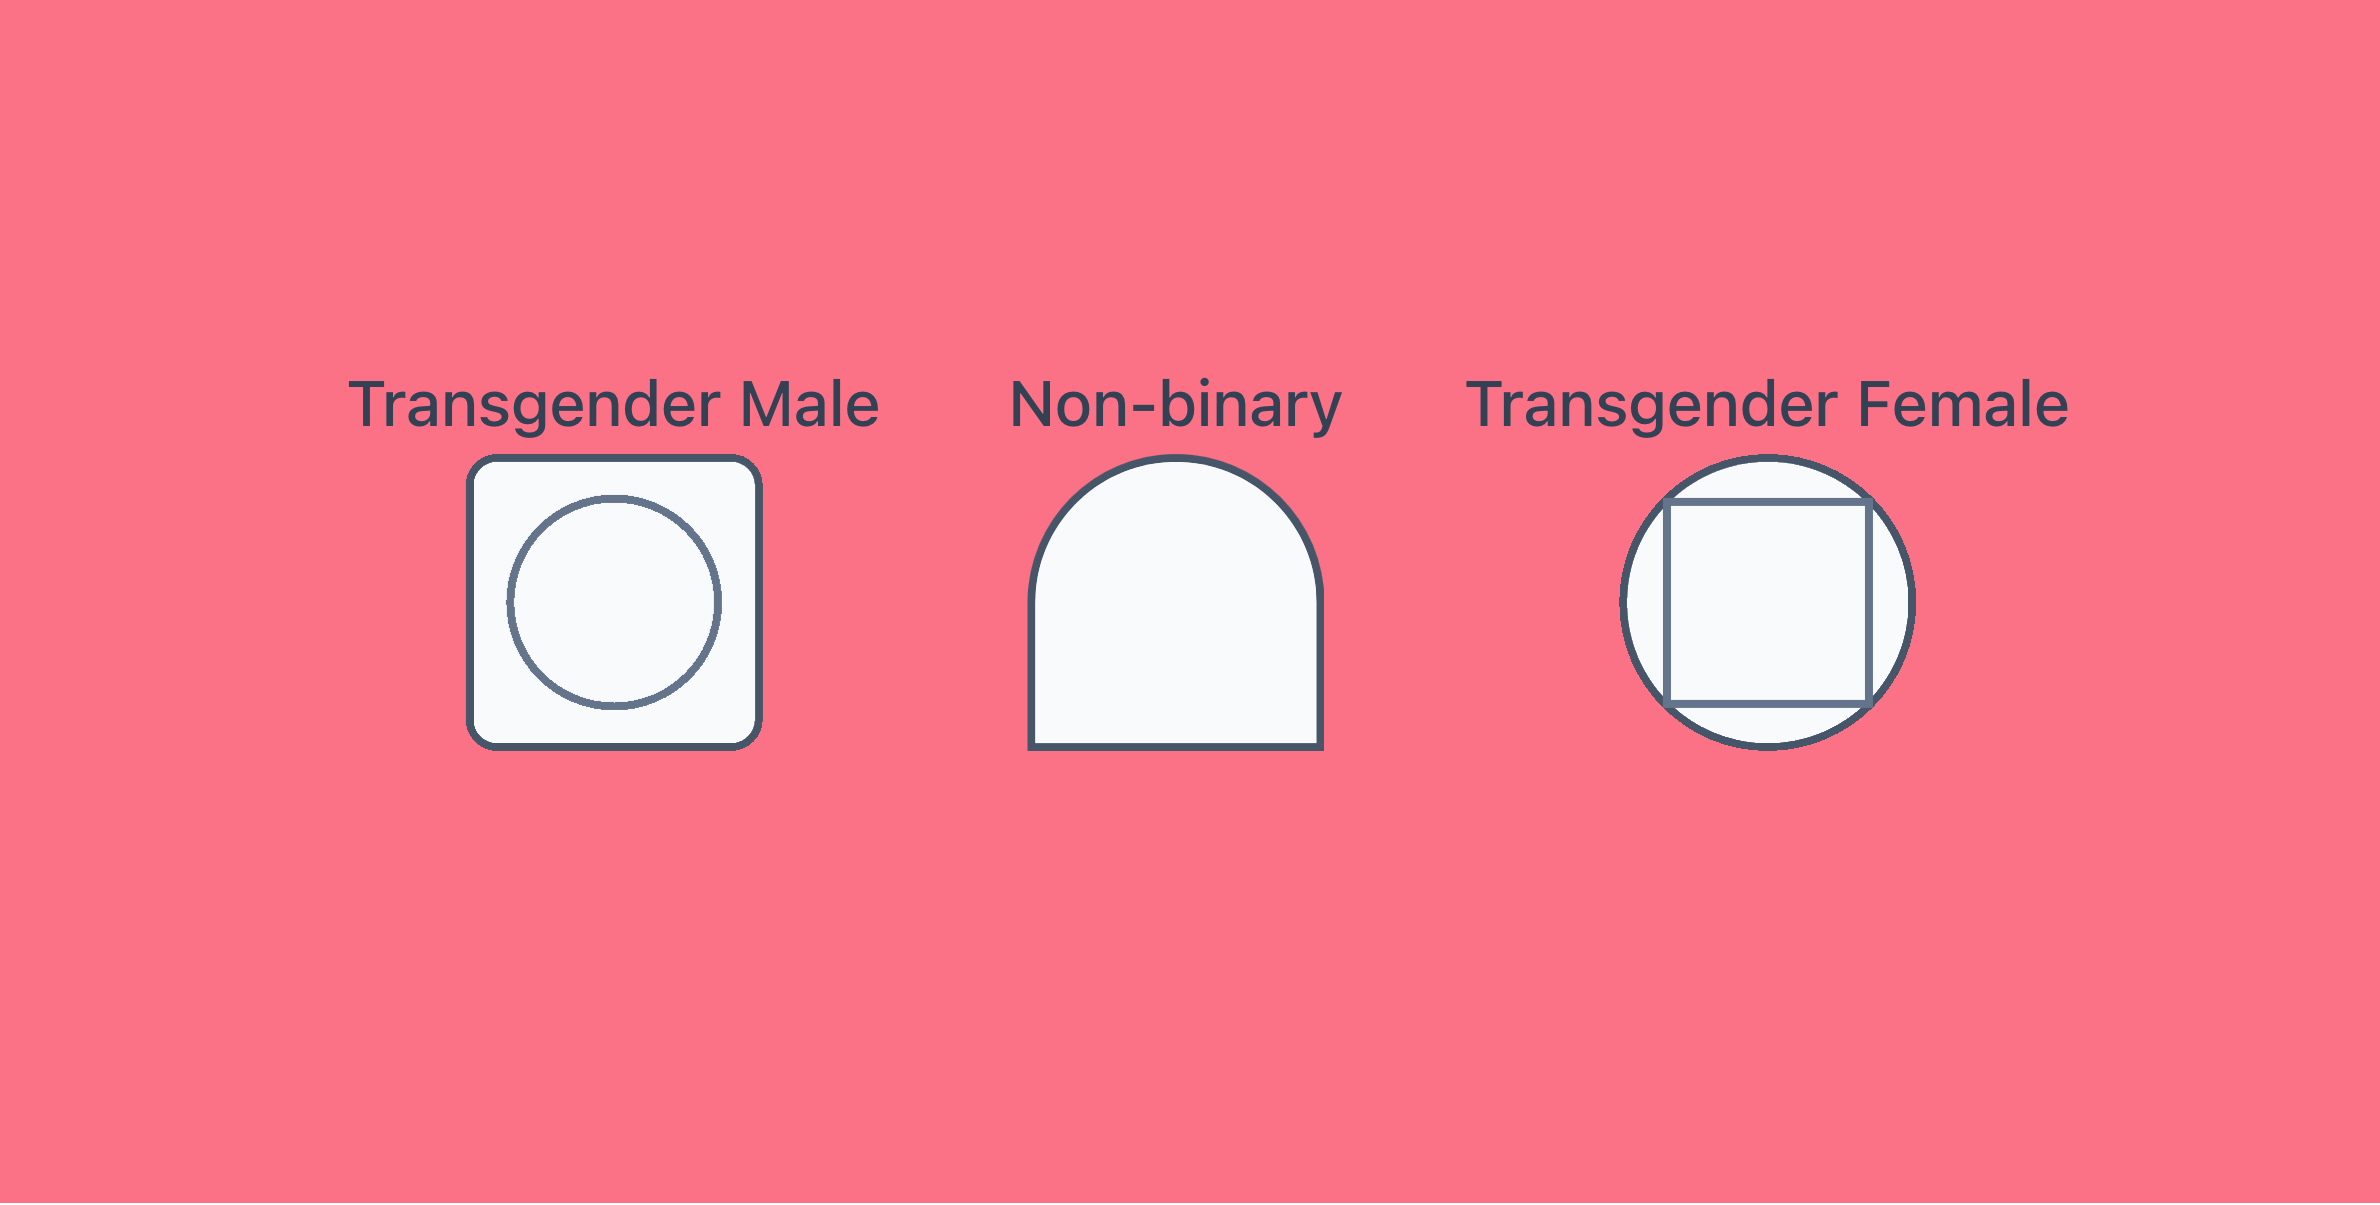
Note: You may have come across different non‑binary symbols, such as a diamond or rhombus shape. Choose the symbol that works best for your chart and include a simple legend, so your choice is easily understood.
- Labelling nodes. You can put names (or initials) and birthdates outside the shapes to keep the nodes clean - this approach works well when you have lots of other symbols or annotations inside (we'll move onto this later).
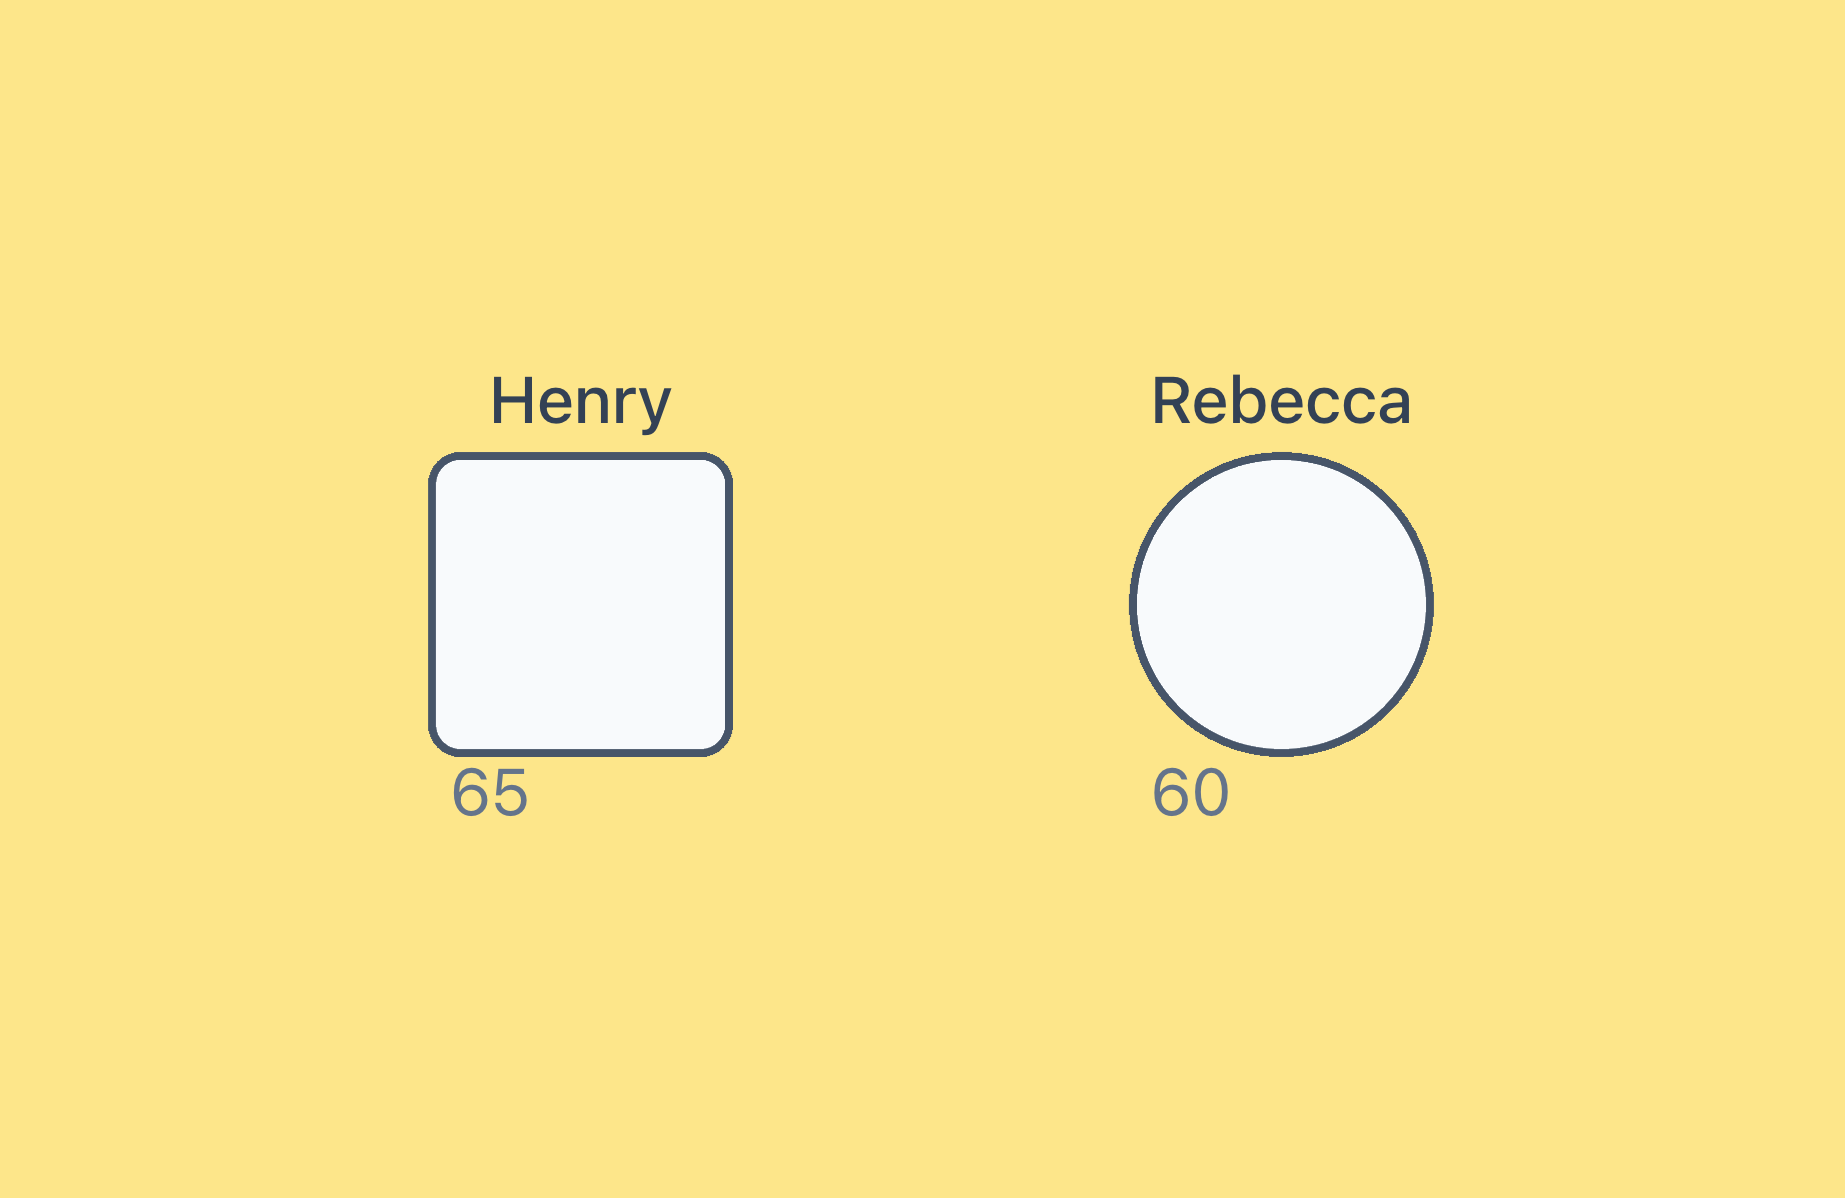
Note: Some genogram styles add these details inside the shape, which can work fine for simpler charts with fewer extra symbols.
- Consider sexual orientation. If you feel it is important, then you may want to illustrate sexual orientation; you can do so by using the following symbols:
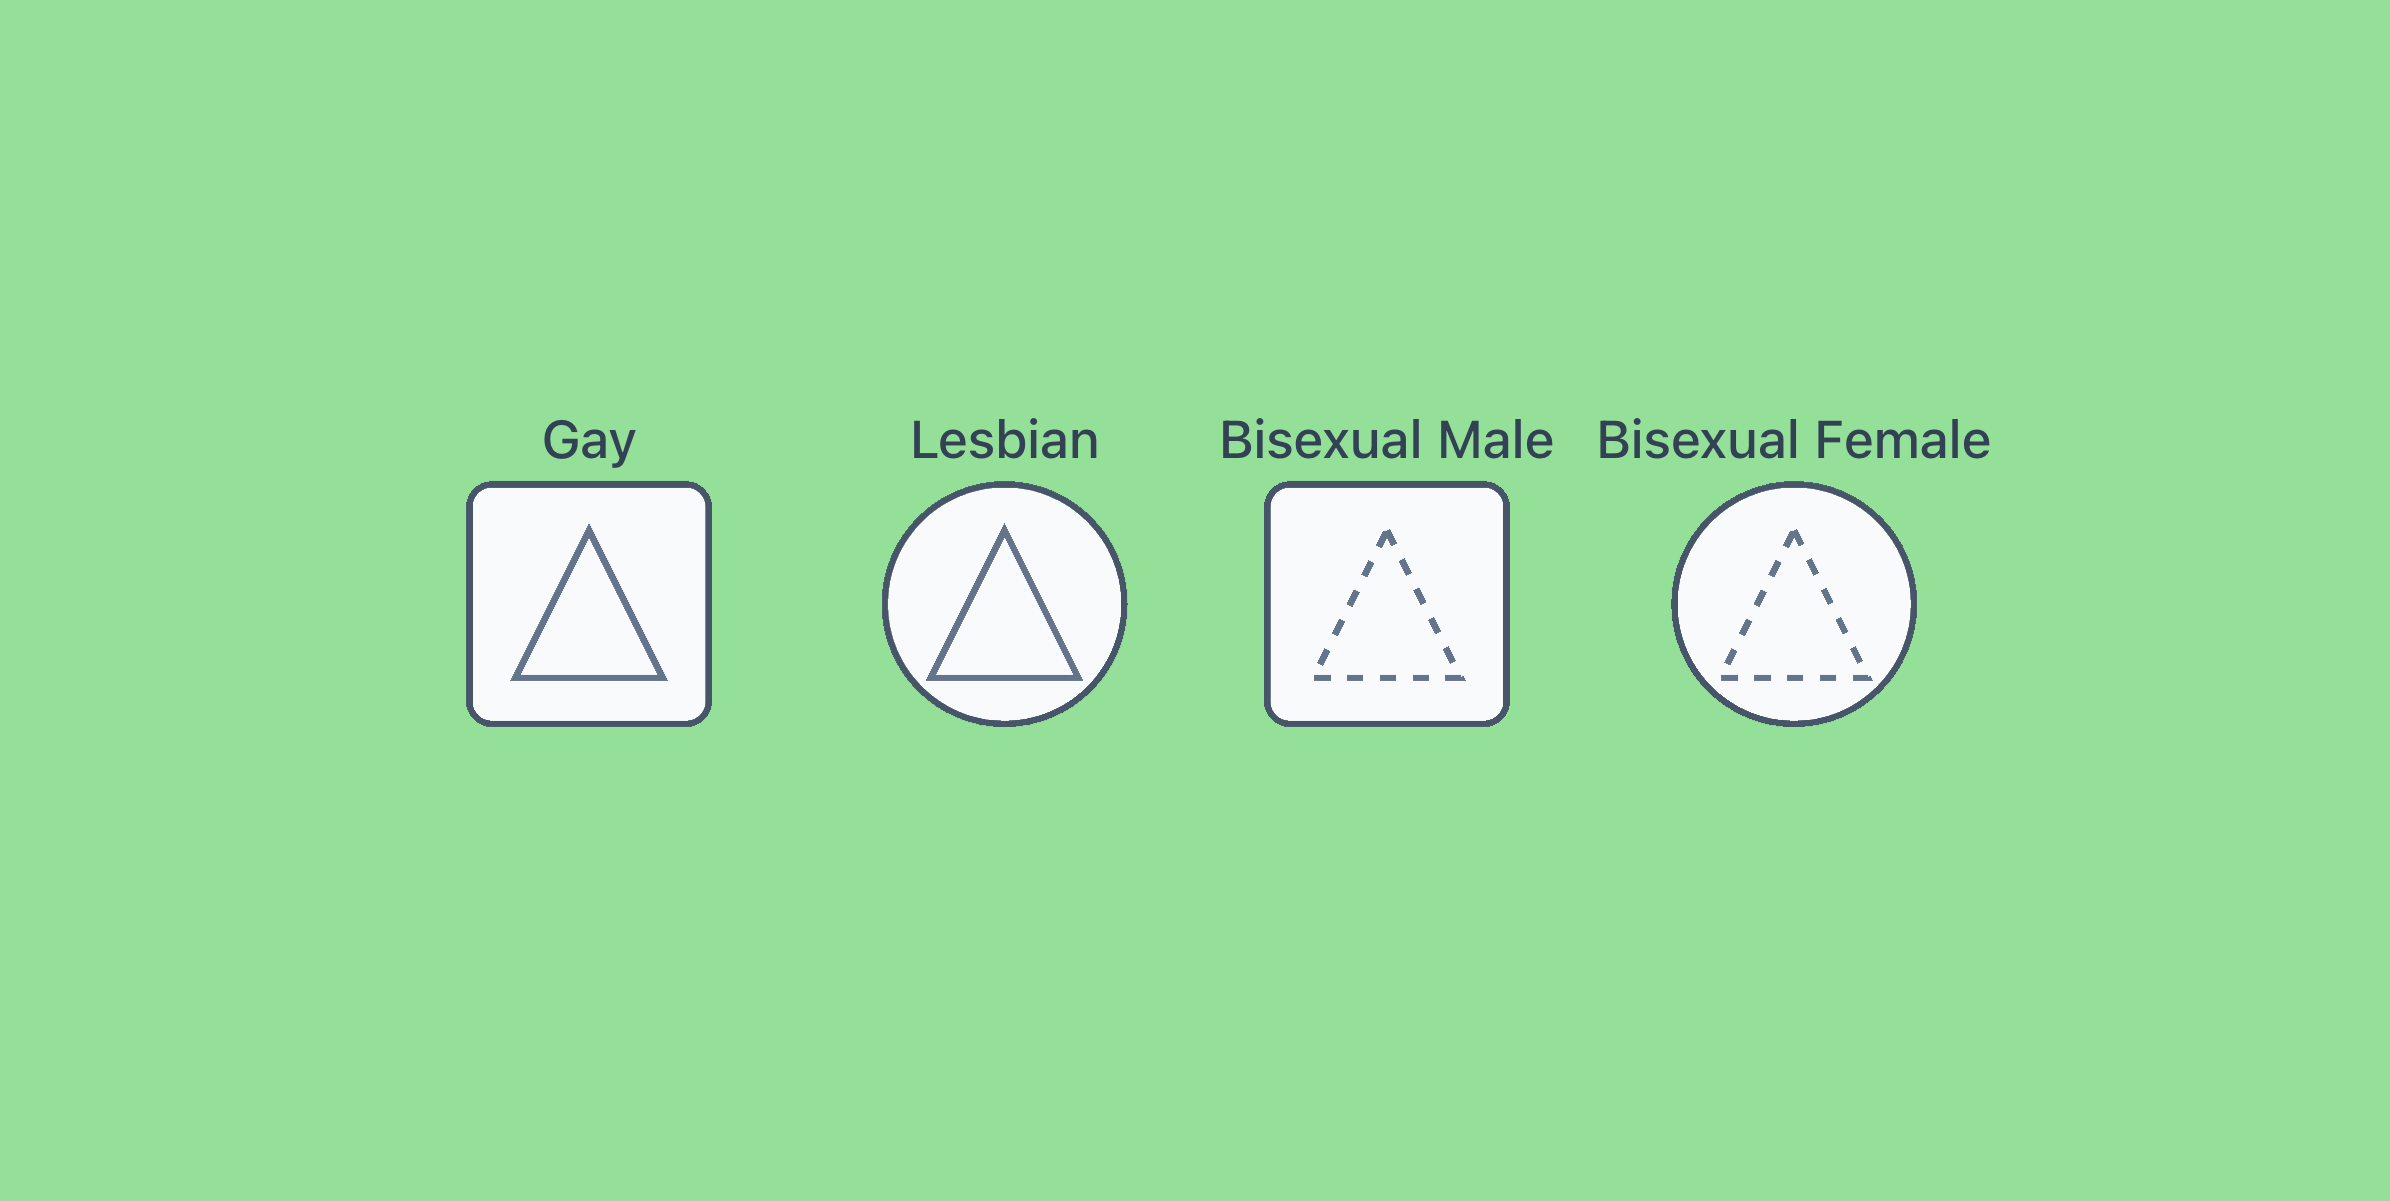
Note: Some tools or references may use a double triangle inside the square or circle.
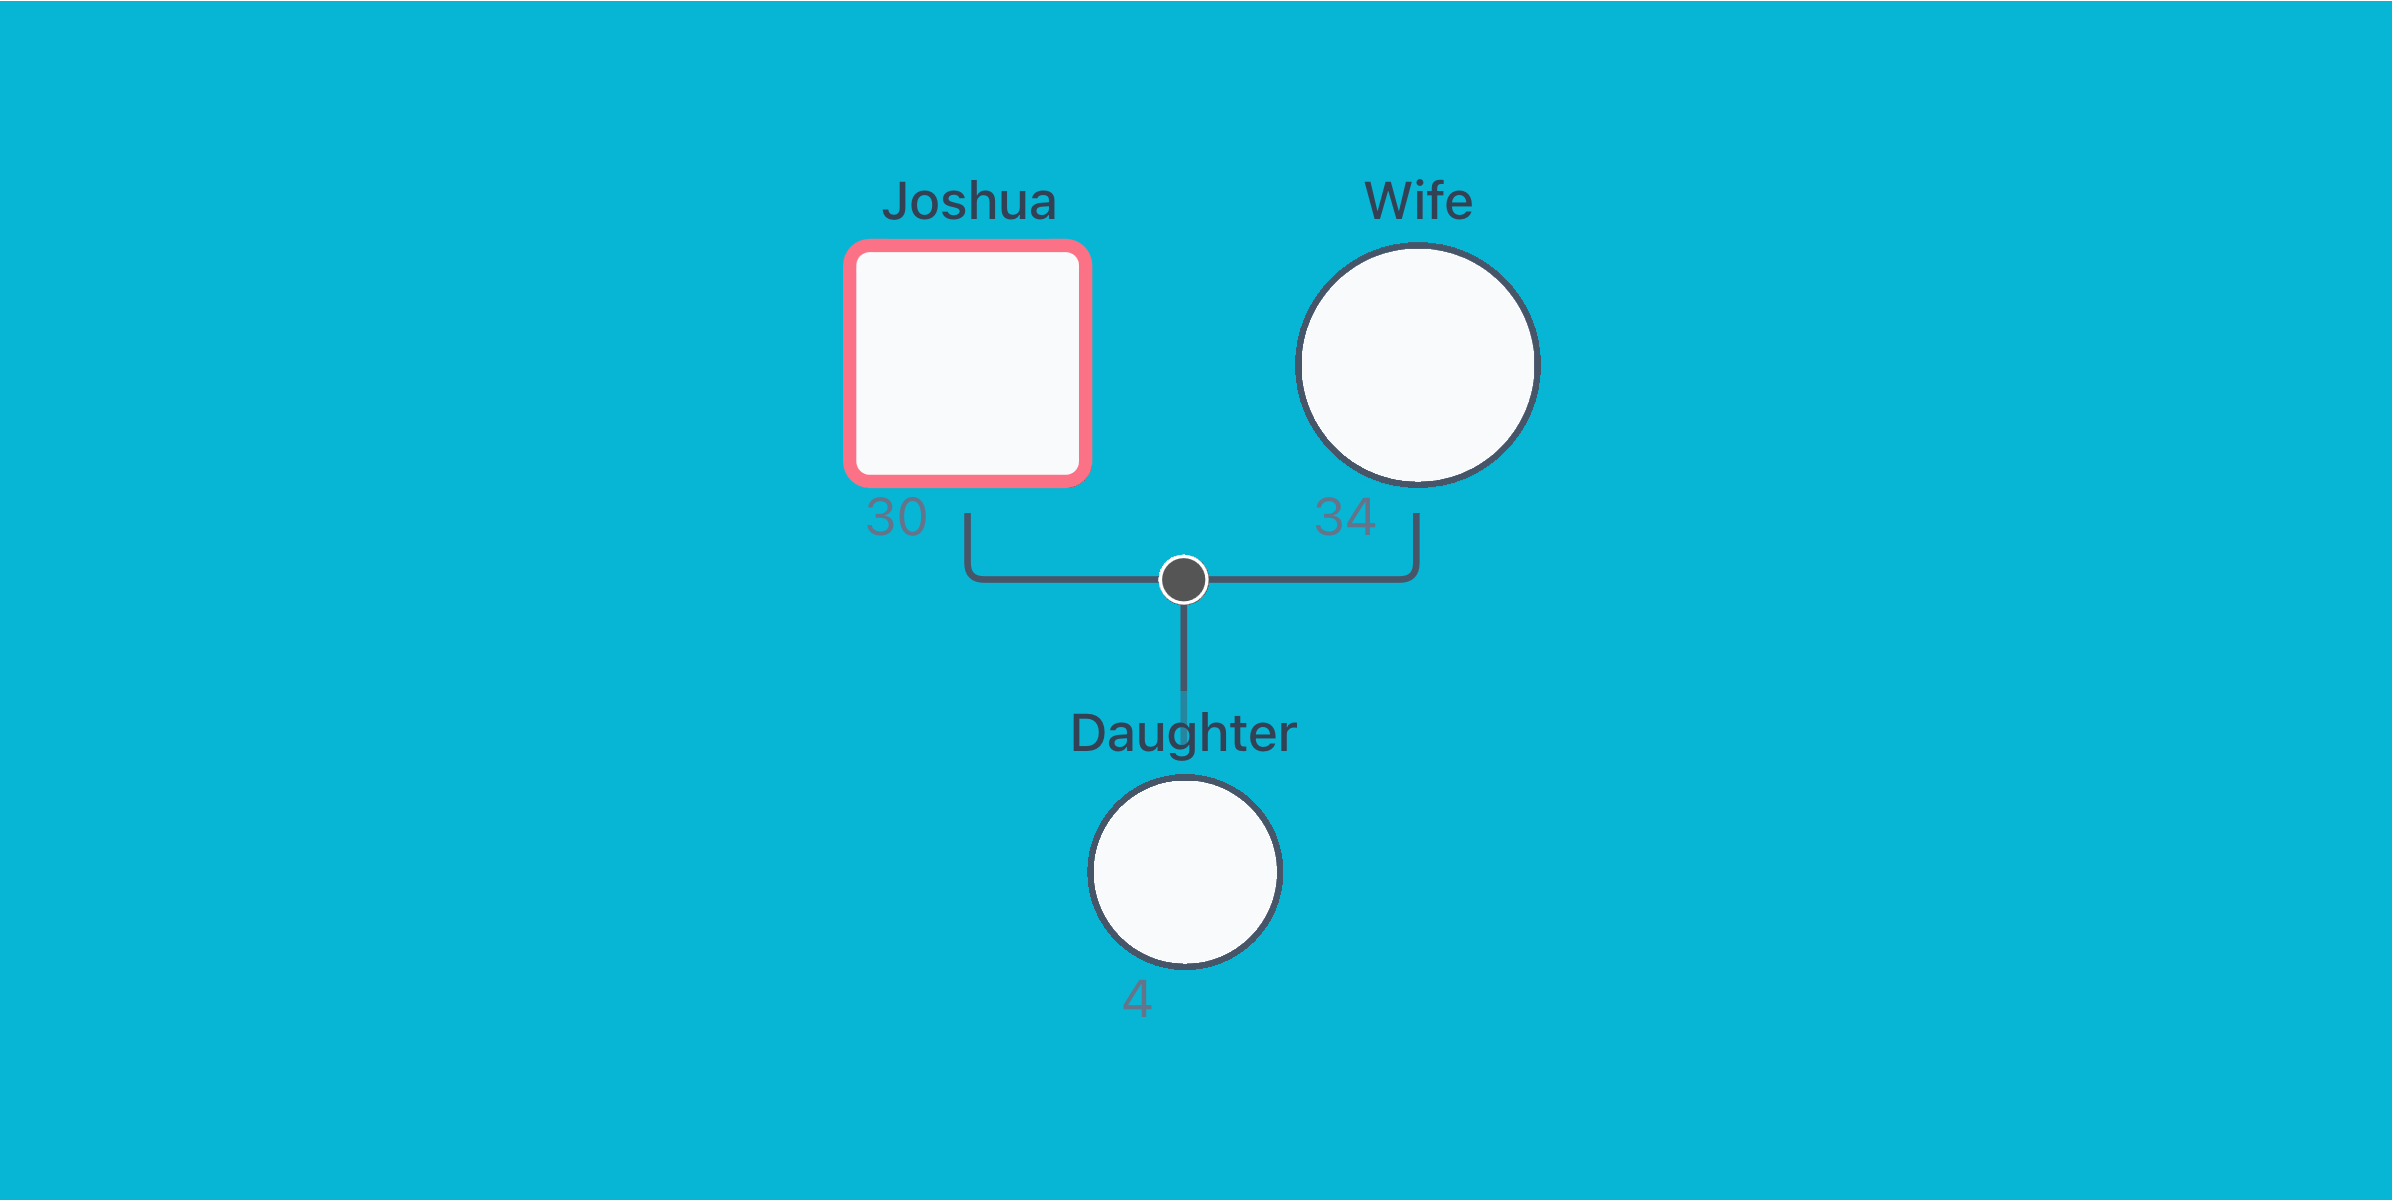
- Highlight the Main Subject. Clearly mark the "main subject" which is the person the genogram focuses on. Do this by using a double line or a thicker border around their node. This makes the chart easier to read for anyone else and ensures labels like aunt, uncle, or grandmother are clearly tied to the right person.
In this example, “Joshua” is the main subject:
Step 3 - Add life status, health conditions, and behavioural markers
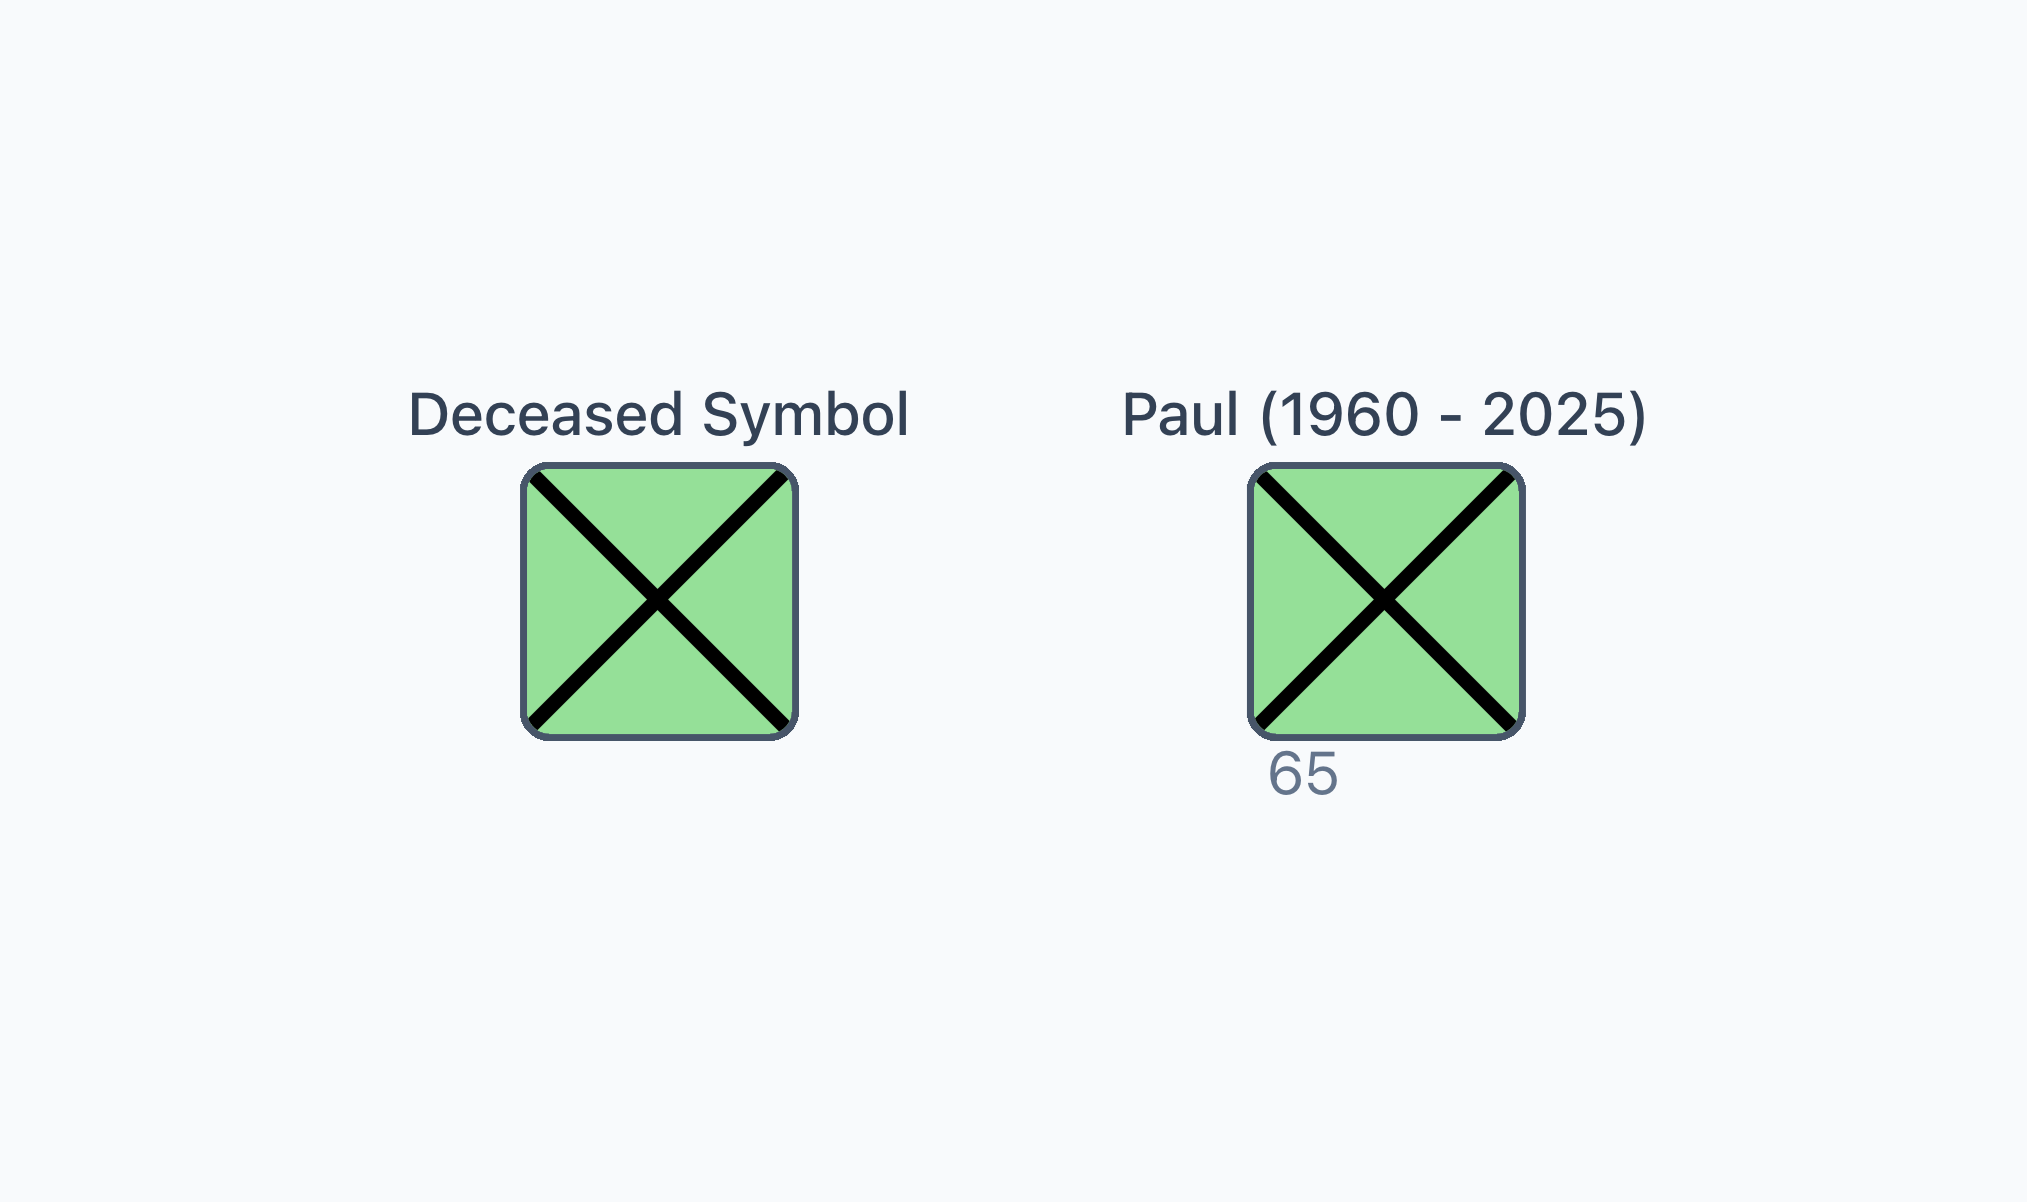
- Mark life status: Put a big X through the node of anyone who’s passed away and you can add birth/death dates beside the shape.
- Mark Health Conditions & Dependencies. You can denote psychological or physical health issues with small symbols or abbreviations inside the node.
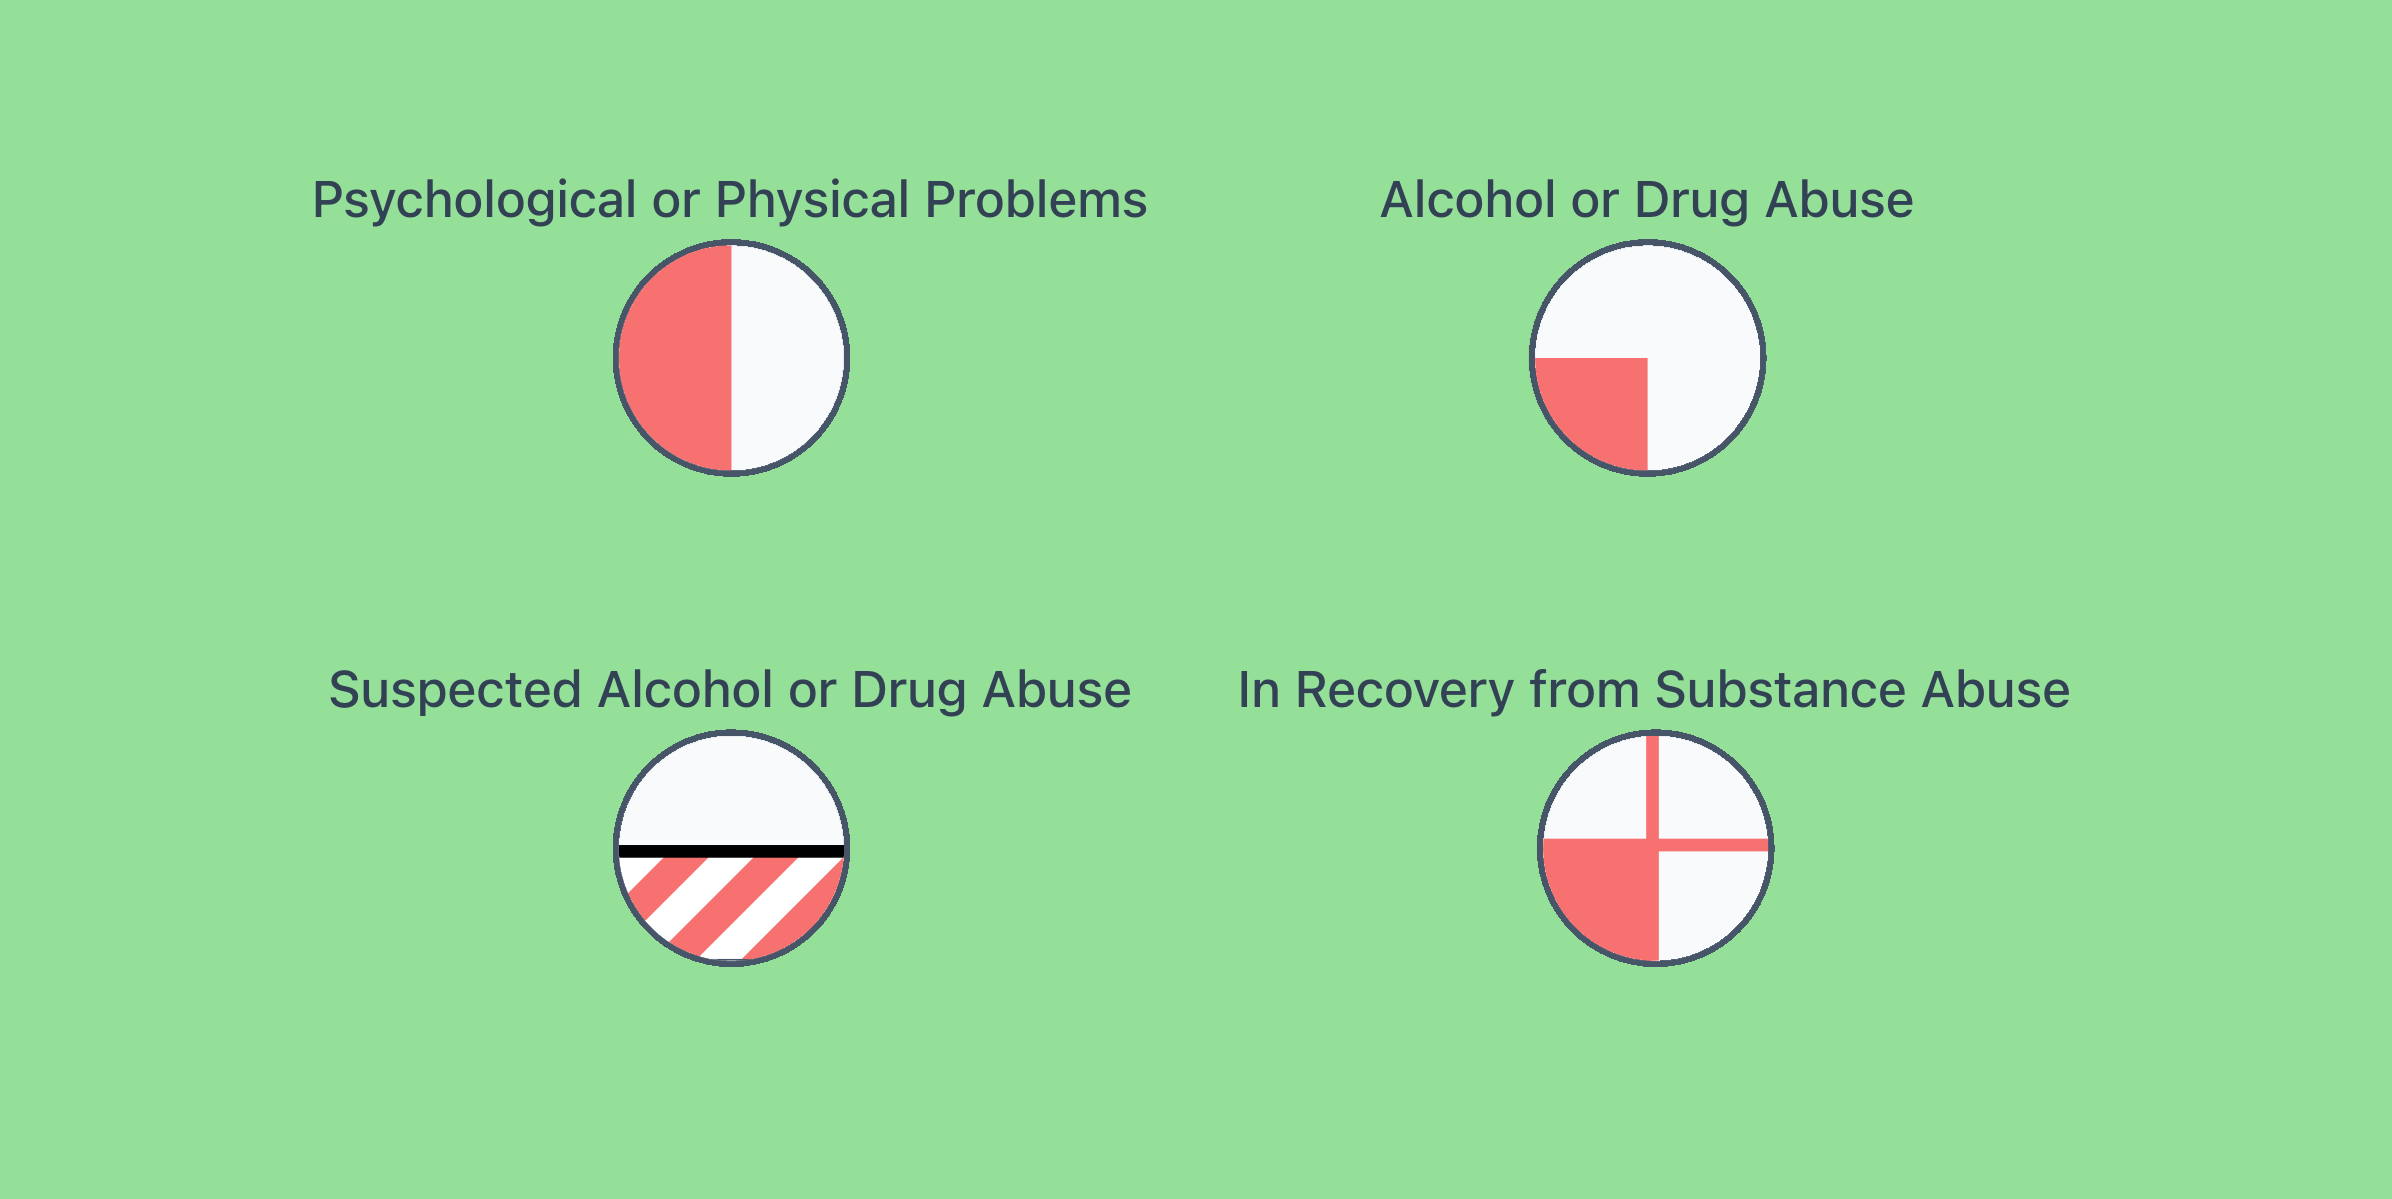
Note: If you're hand-sketching your genogram, you might use a simple abbreviation like “D/A” inside a node to indicate drug/alcohol issues - just make sure to include a legend so it’s clear.
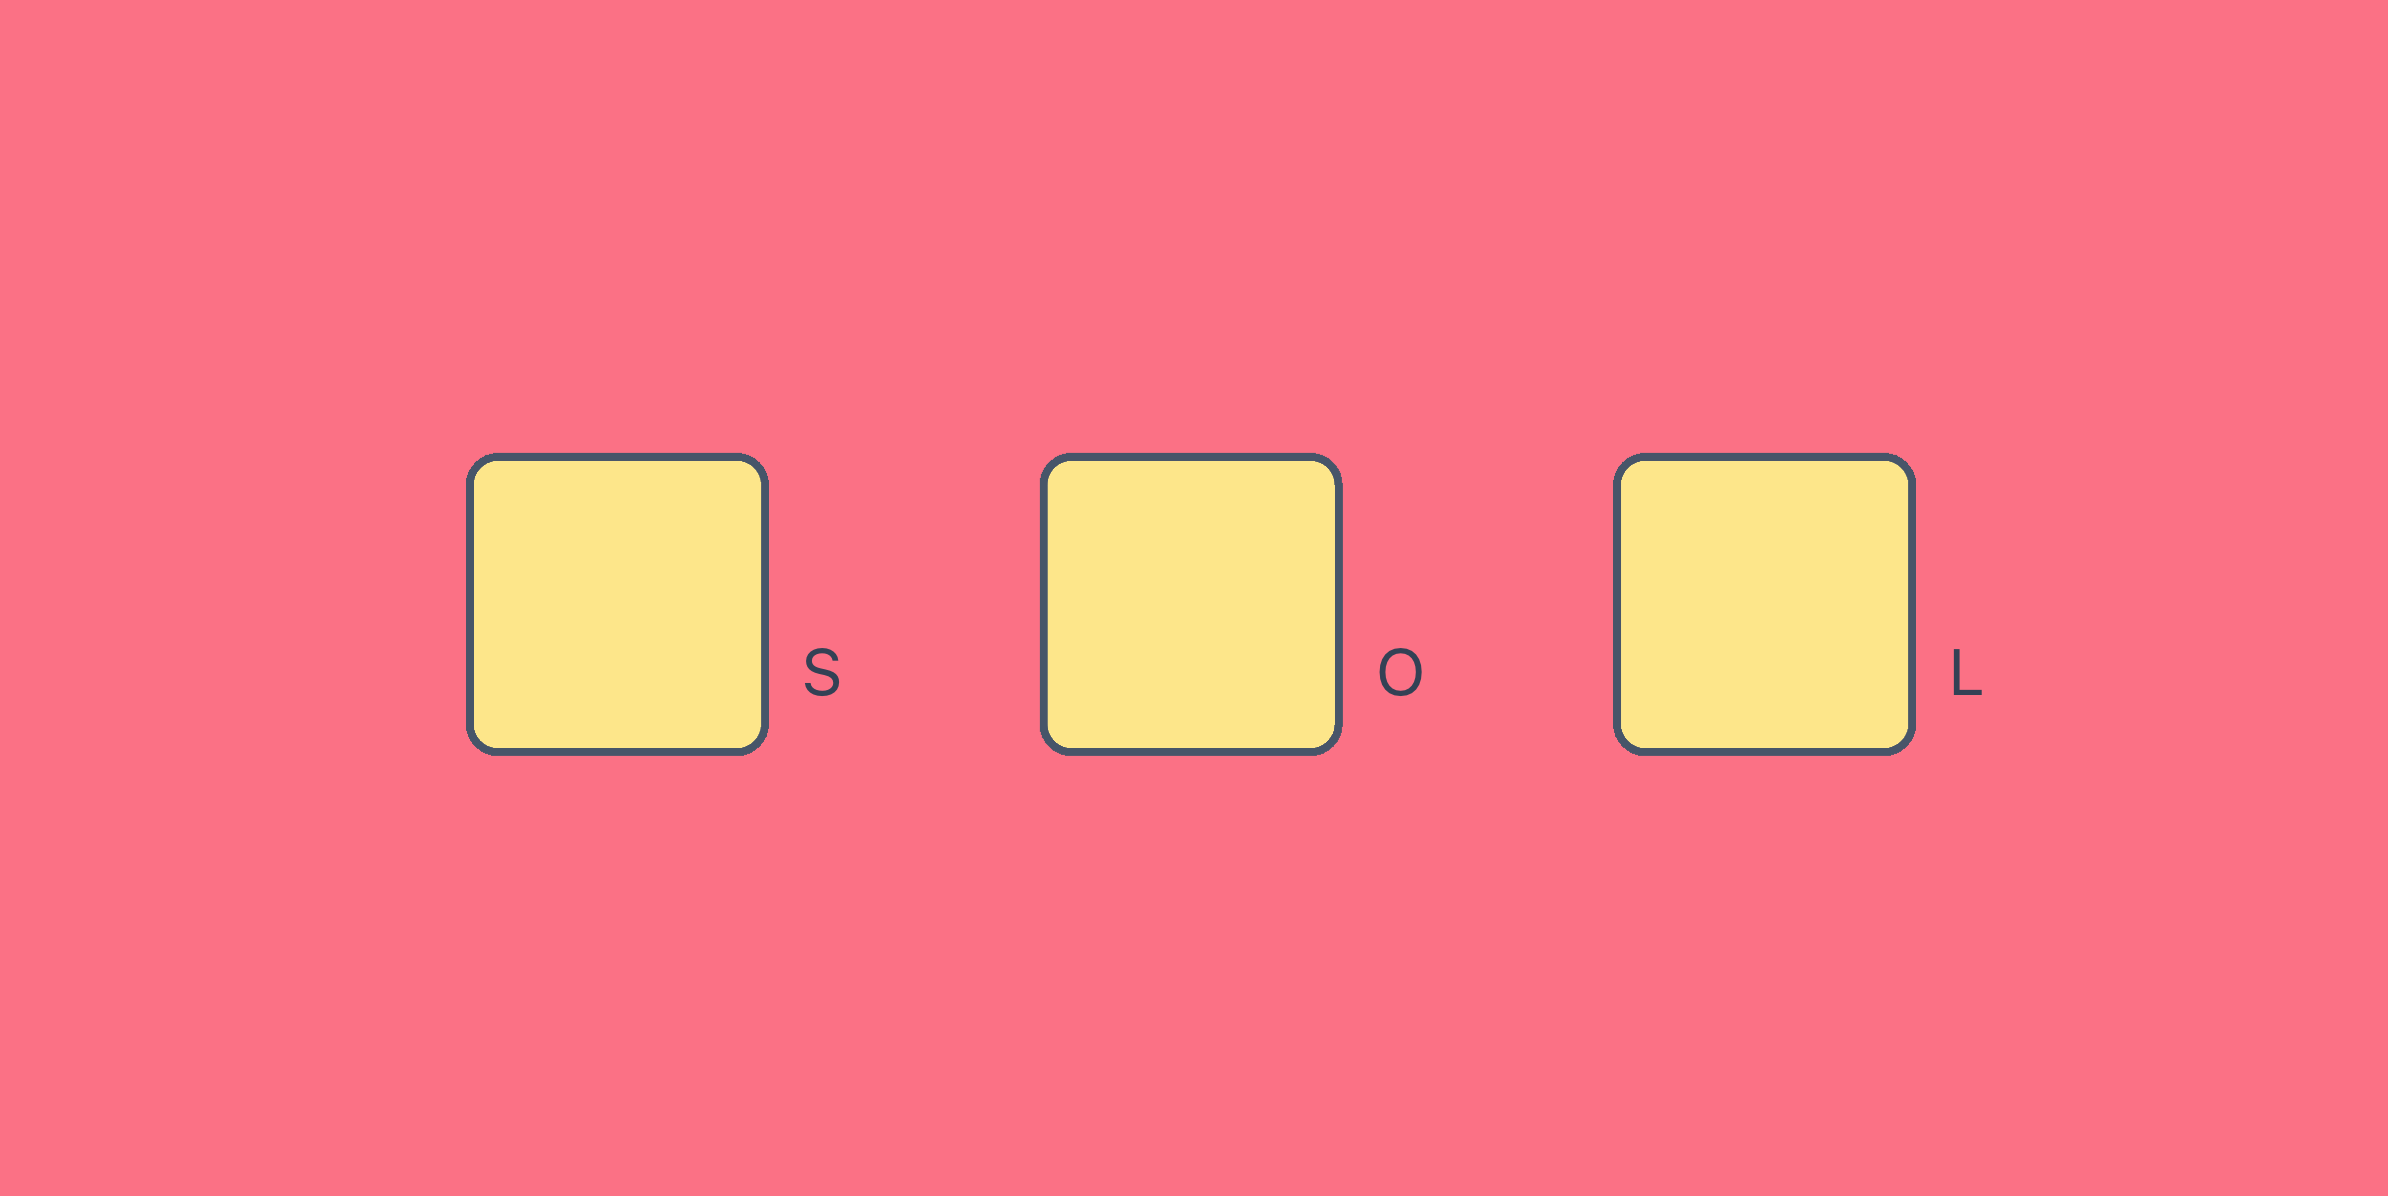
- Flag lifestyle and Support Needs. Highlight key details by placing letters just outside the node - S for smoker, O for obesity, or L for language difficulties - whenever these factors are relevant.
Step 4 - Connect Couples and Relationships
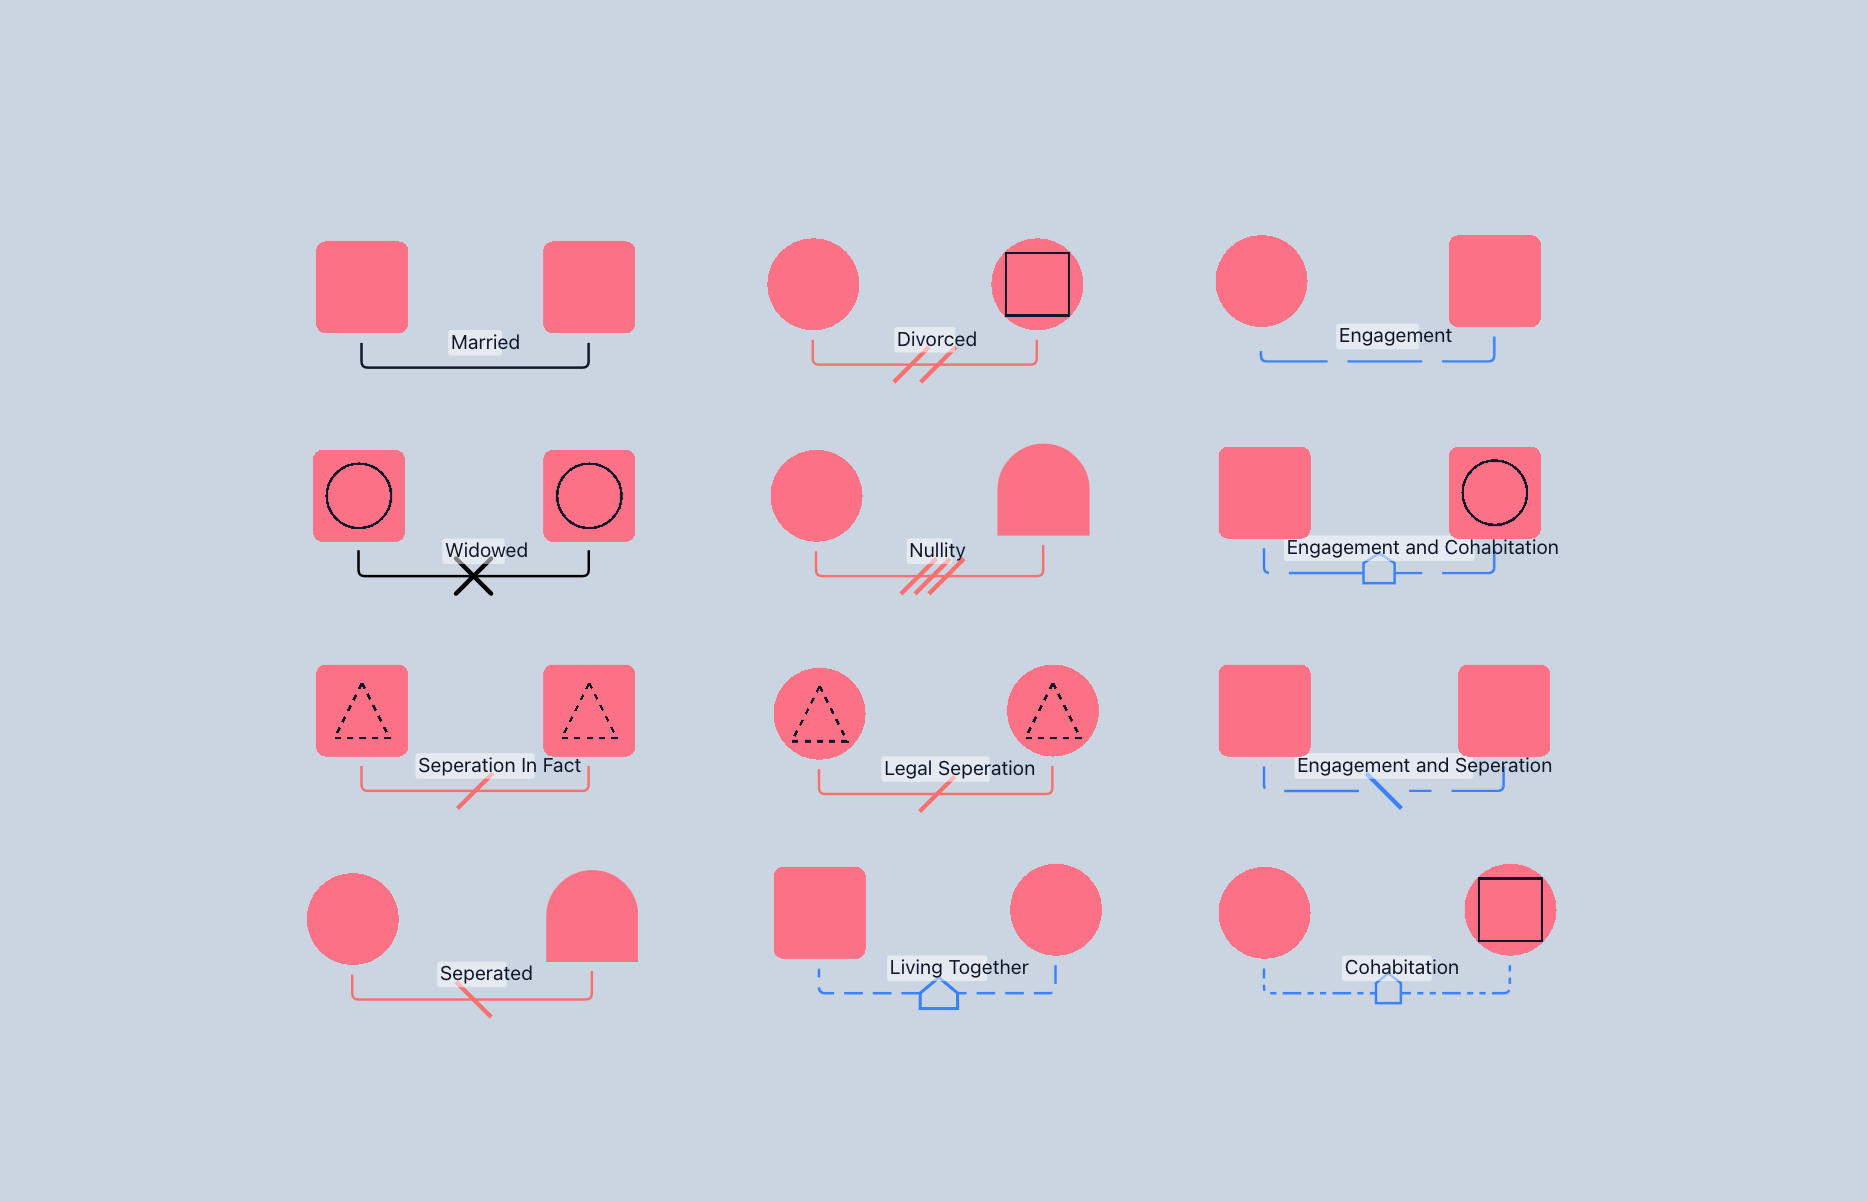
- Connect Relationship Lines Beneath Nodes. Relationships are illustrated by connecting two nodes with a line underneath them. The nature of this line will vary depending on the type of relationship.
- Be aware that marriage tends to be the default on digital genogram tools and is depicted using a solid black line.
Here are some common examples to get you started:
Step 5 - Add Children and Structure Generations Clearly
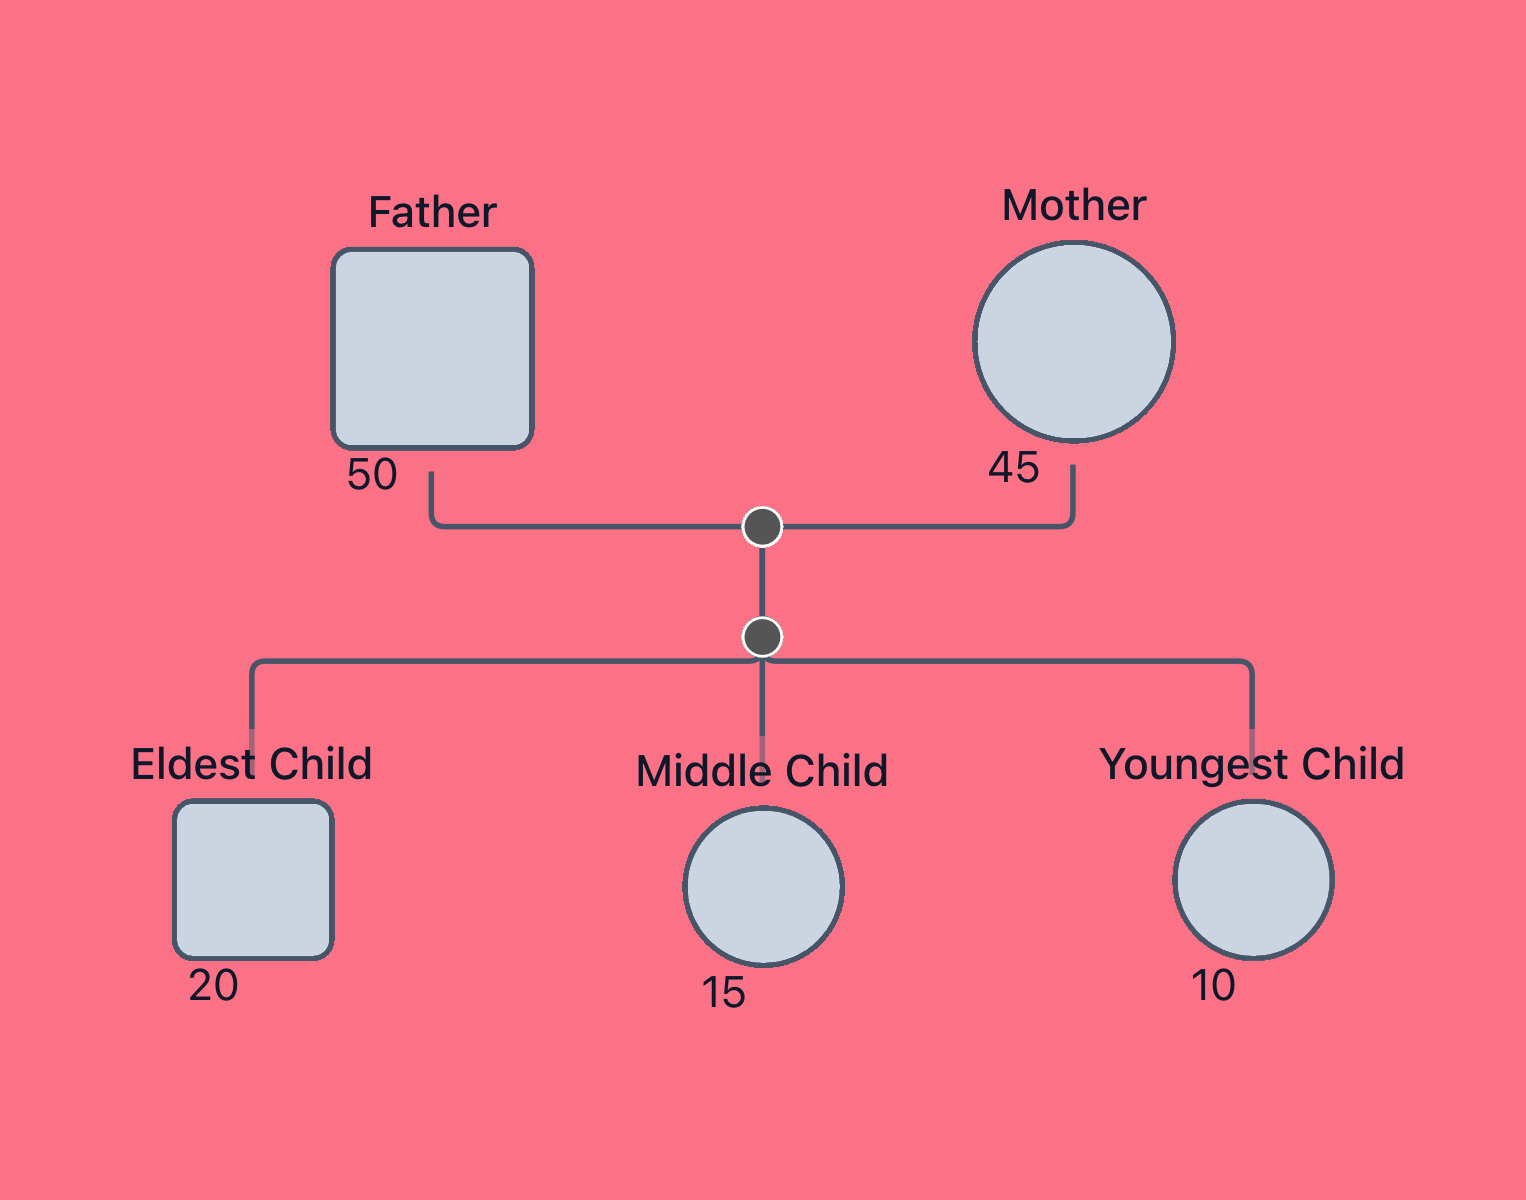
- Place children under parents. Draw vertical lines down from the couple’s union line to each child, ordering siblings left (oldest) to right (youngest).
Child nodes are typically drawn slightly smaller than parent nodes, as shown in the example below:
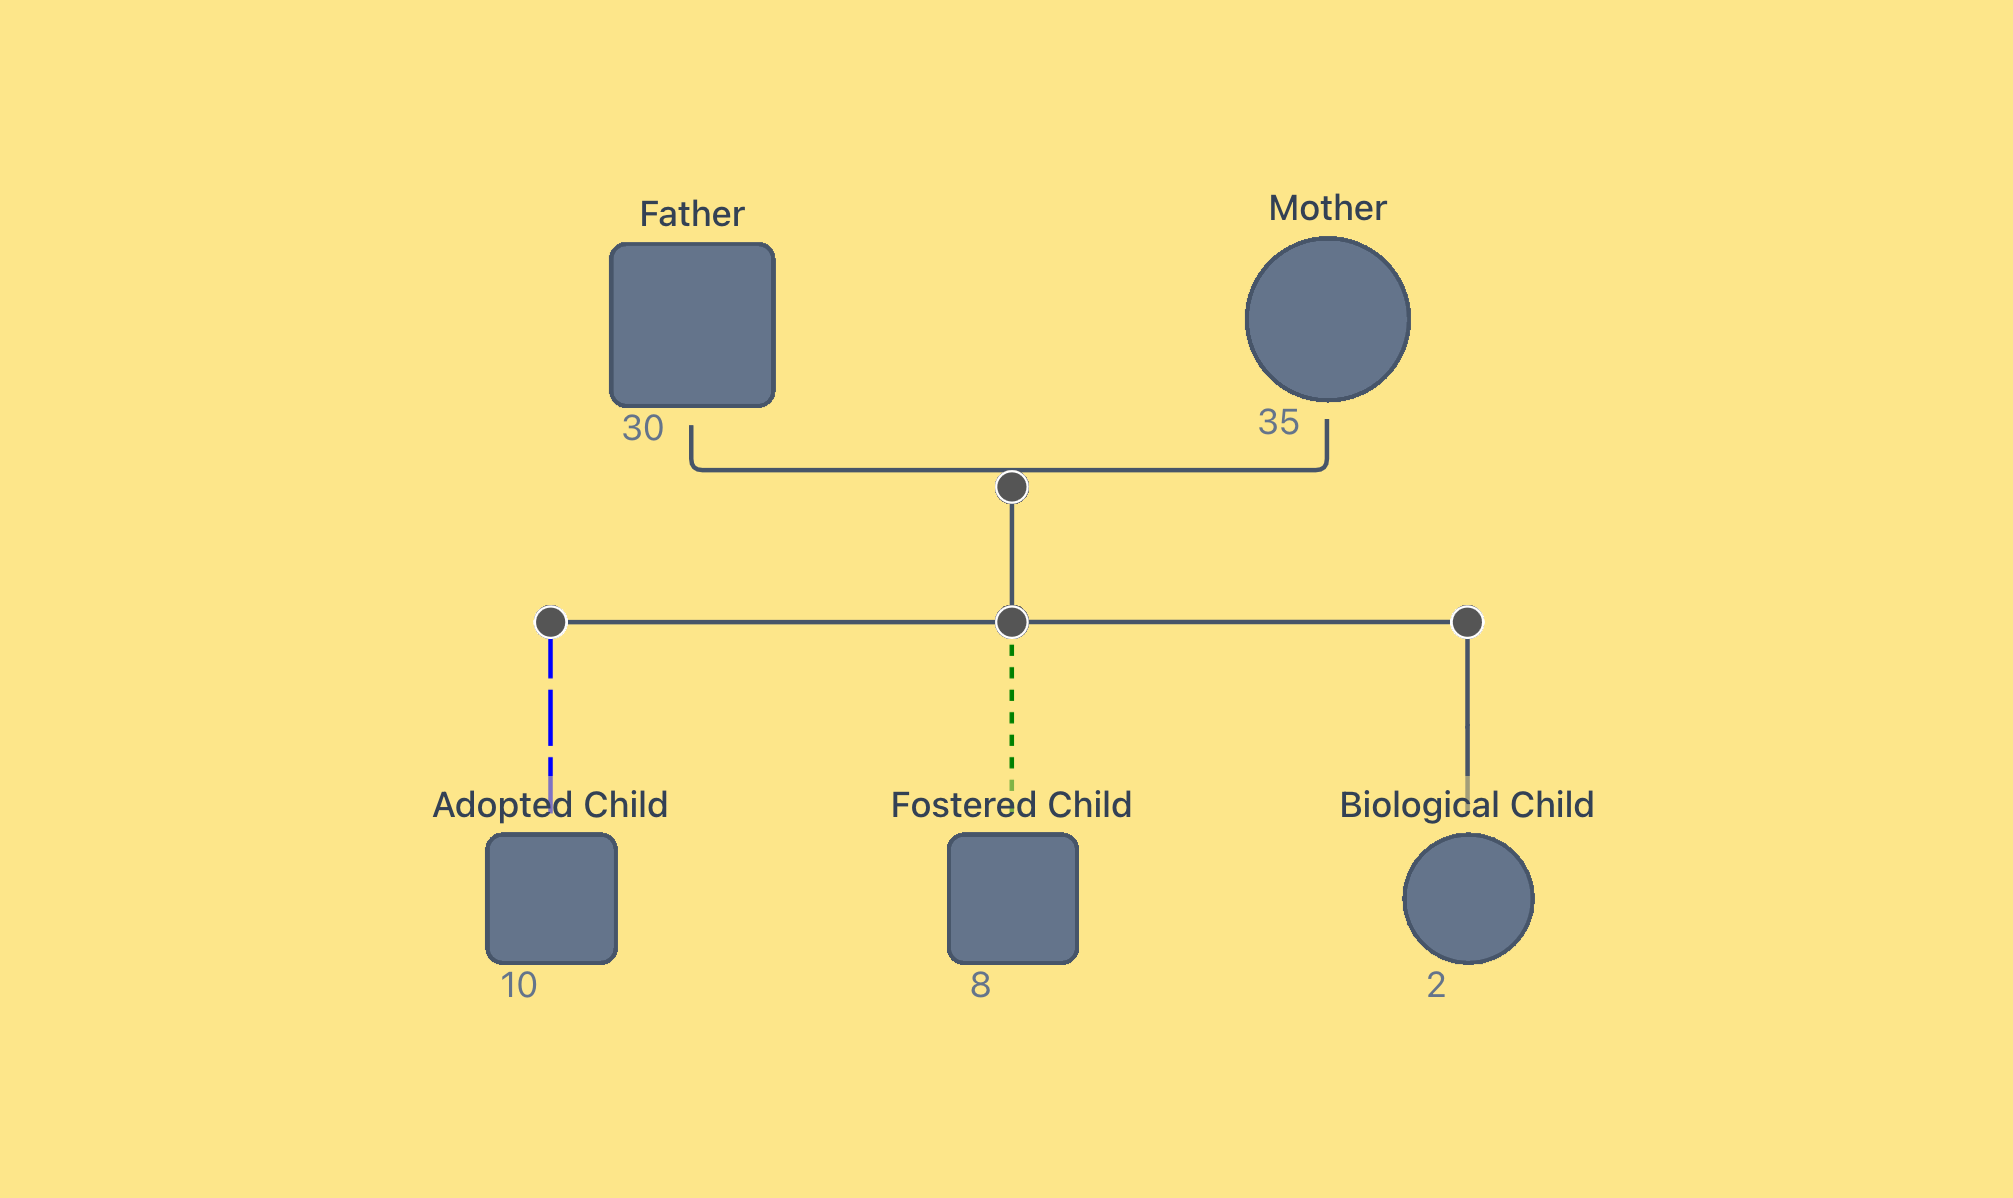
- Use appropriate link lines. If the child is biological, a solid line is standard. For adopted or foster children, you might use a dashed line or label it accordingly. (For beginners, just note it in writing.)
In this example, the adopted child is shown with a blue dashed line, the fostered child with a green dashed line, and the biological child with a solid black line:
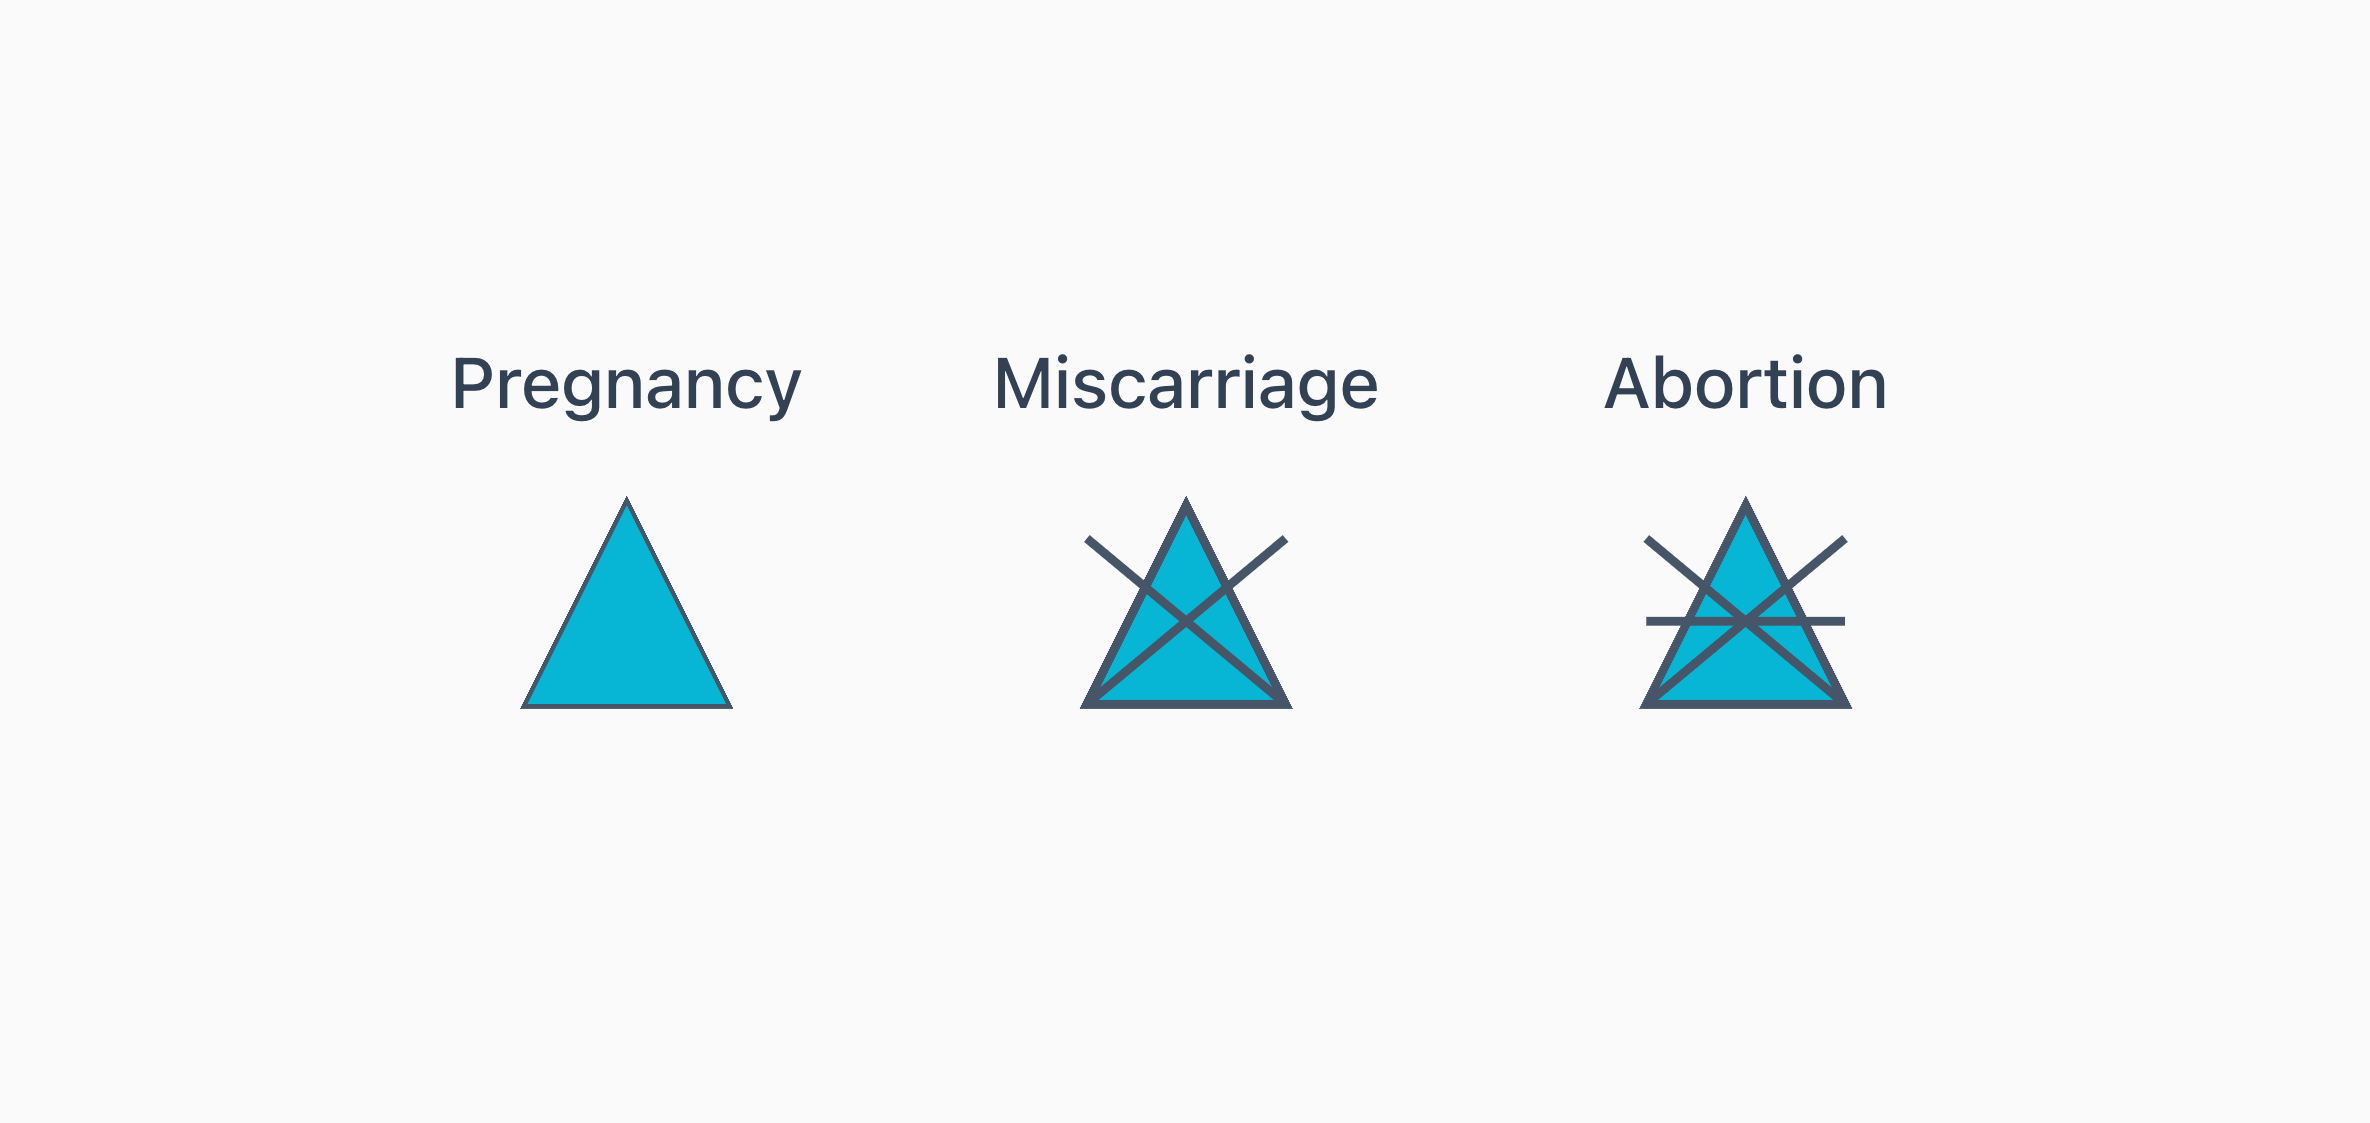
- Mark pregnancies and losses: Use a plain triangle for ongoing pregnancies. If a pregnancy ends in miscarriage, abortion, or stillbirth, add the special triangle‑and‑cross symbol.
- How to Represent Stillbirths. For stillbirths (full-term losses), you can use the standard child symbol - a small circle or square depending on the baby's sex - with a large cross over it. You may choose to label the node “stillbirth,” include the baby’s name, or both. This is a deeply personal choice, so go with what feels most appropriate for you or the person you're creating the genogram for.
- Keep generations aligned. The oldest generation (grandparents, great-aunts/uncles) goes at the top, then their children below them, and so on. This vertical flow from top (elders) to bottom (youngers) makes it easy to follow the family timeline.
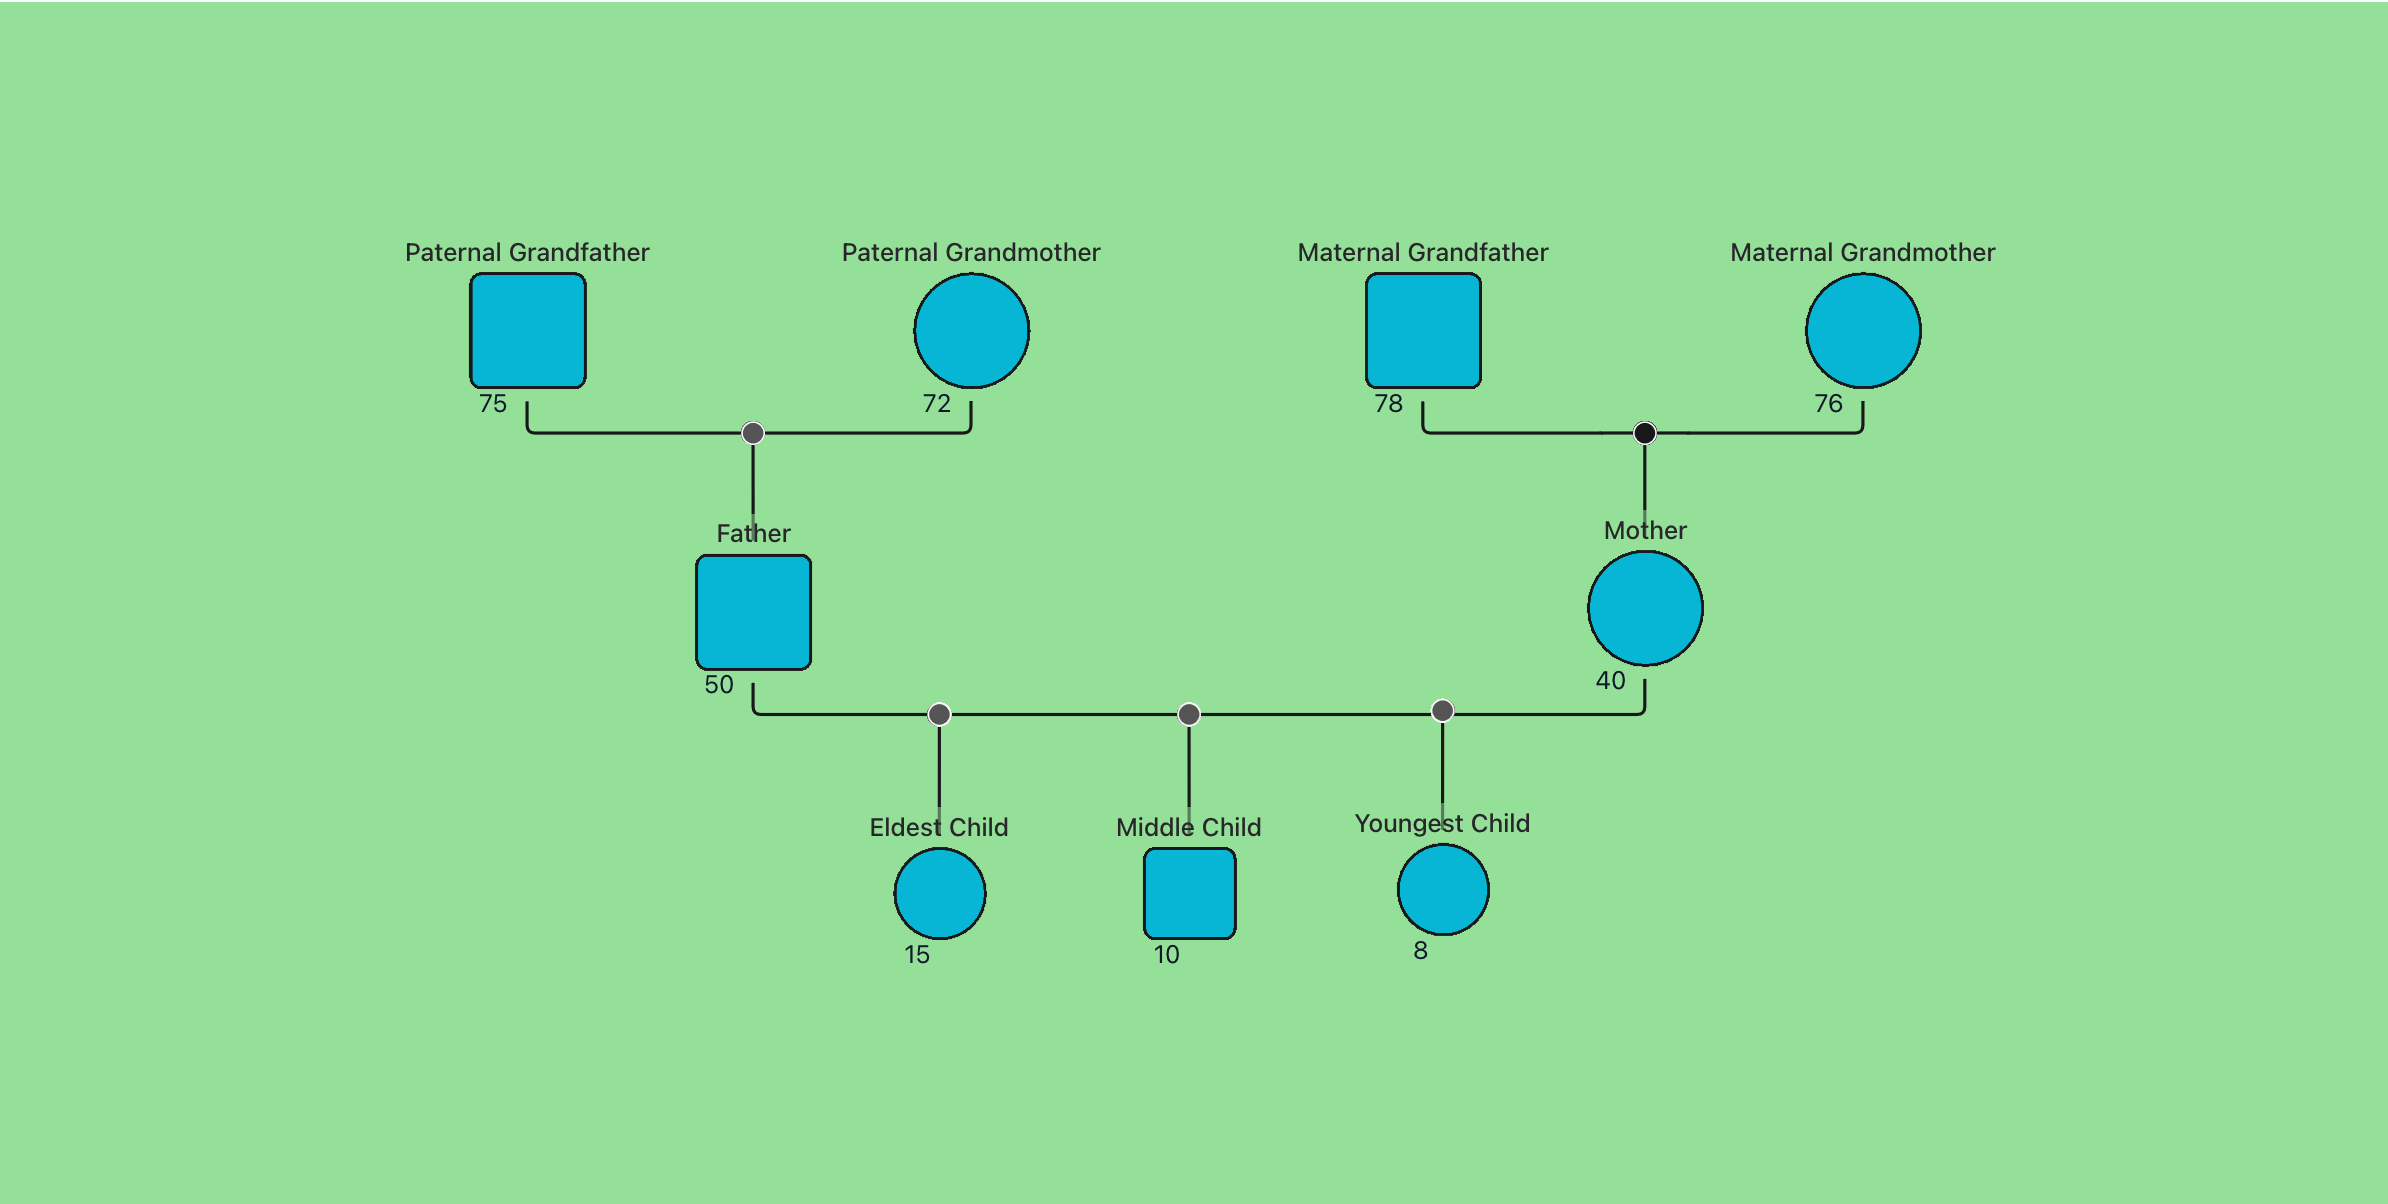
- Place siblings on the same level. As you can see from the example above, all brothers and sisters of one generation should sit on the same row, usually below their parents. List them in age order across the row.
- Include pets as nodes. You may see pets shown with a paw print or a simple diamond shape. For a shared family pet, position its node on the children’s row - always last.
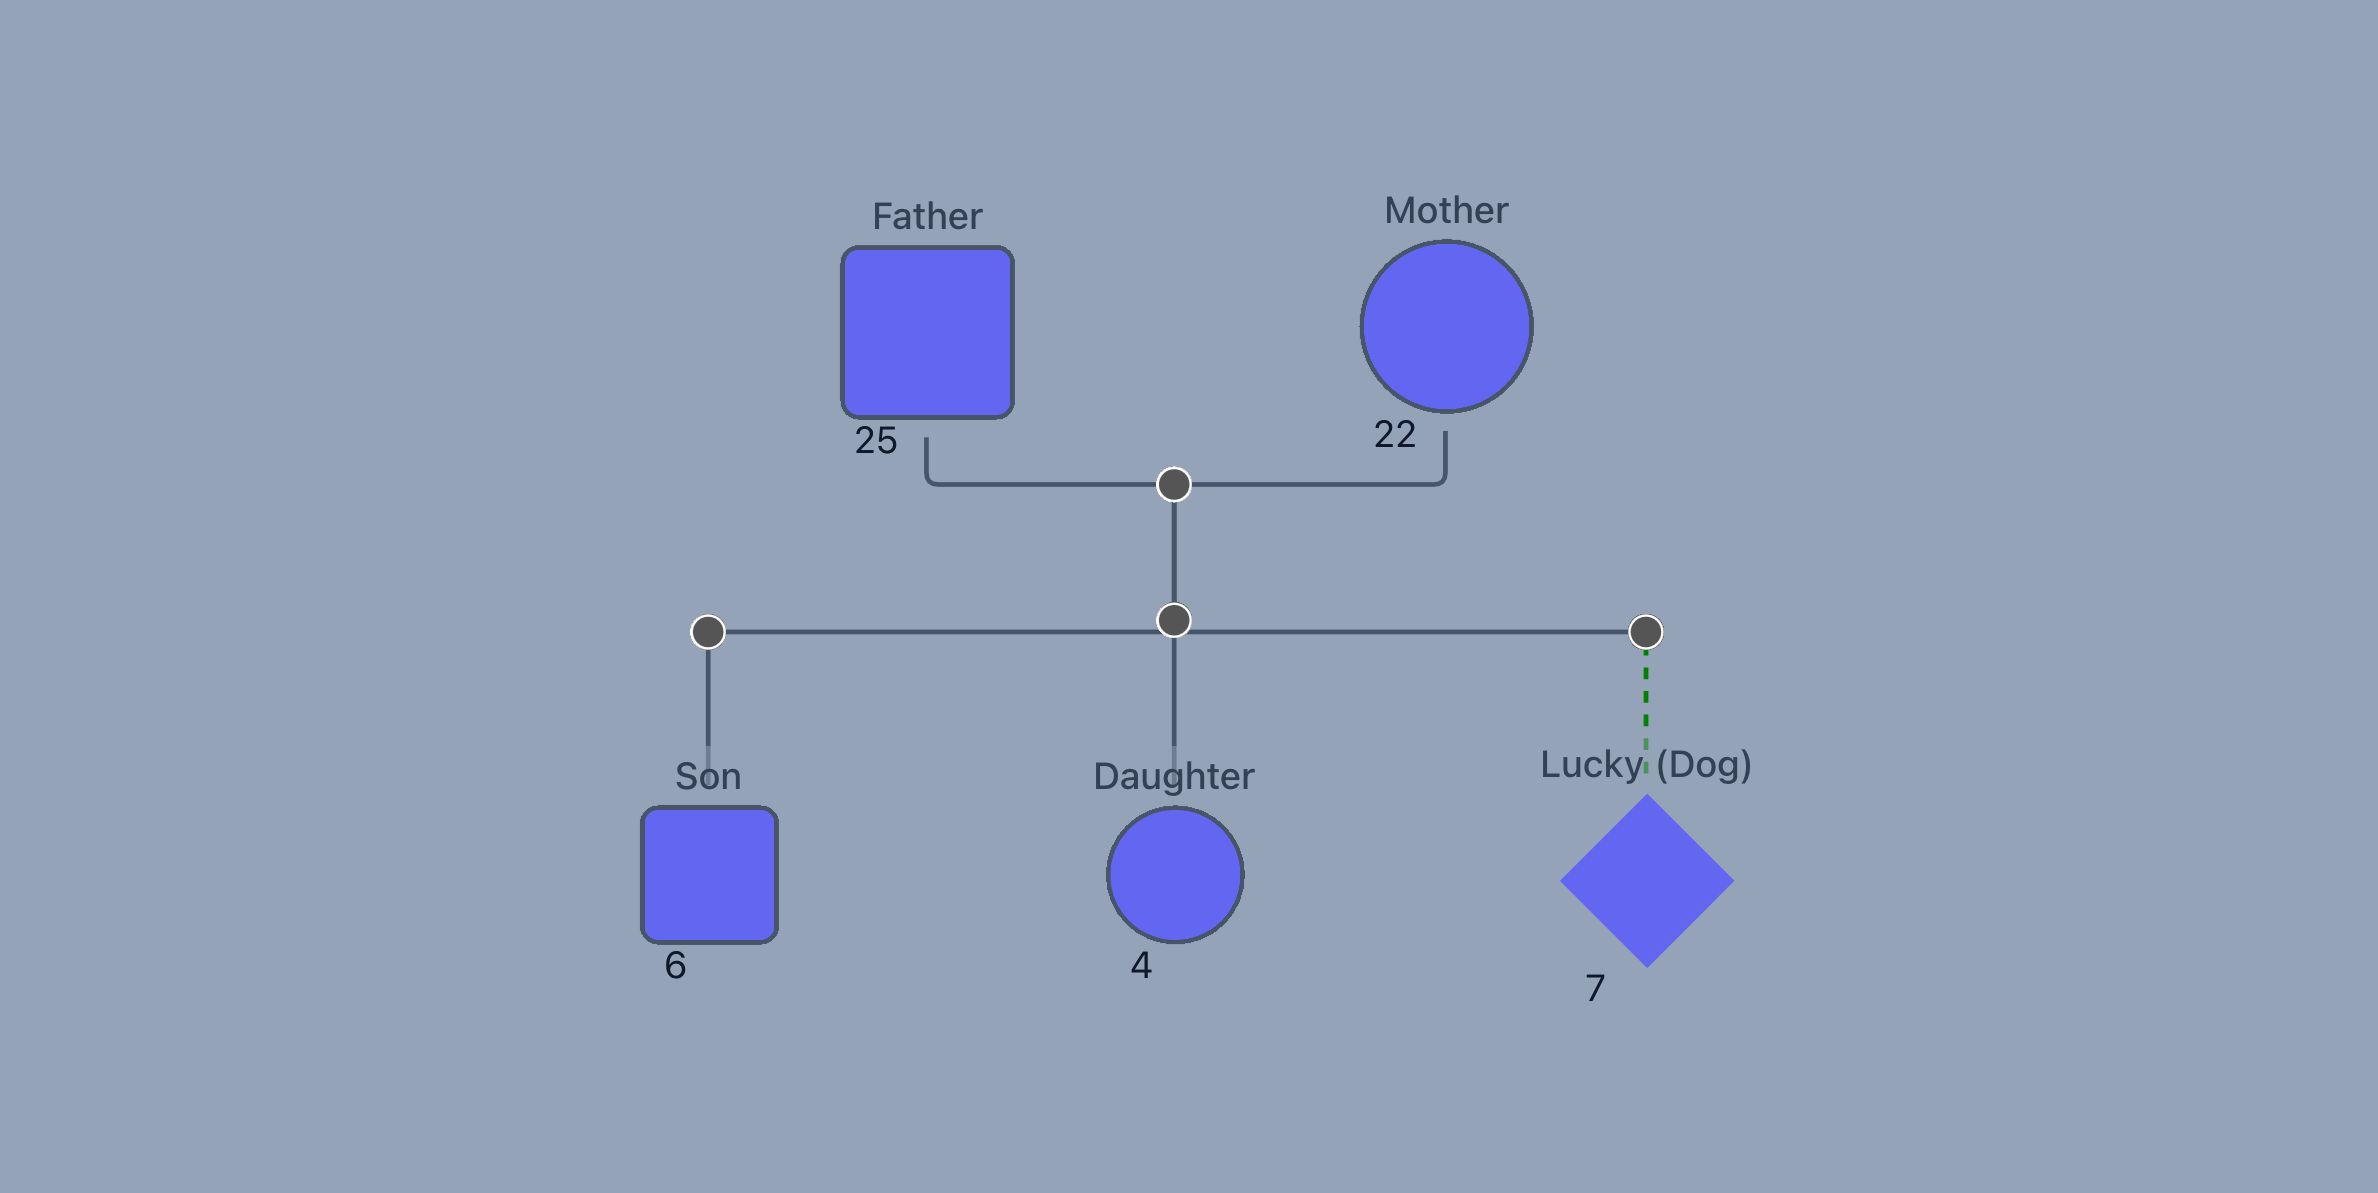
- Connect to a caregiver. If the pet has a primary caregiver, place its node directly below that person and link them to it with a dotted line.
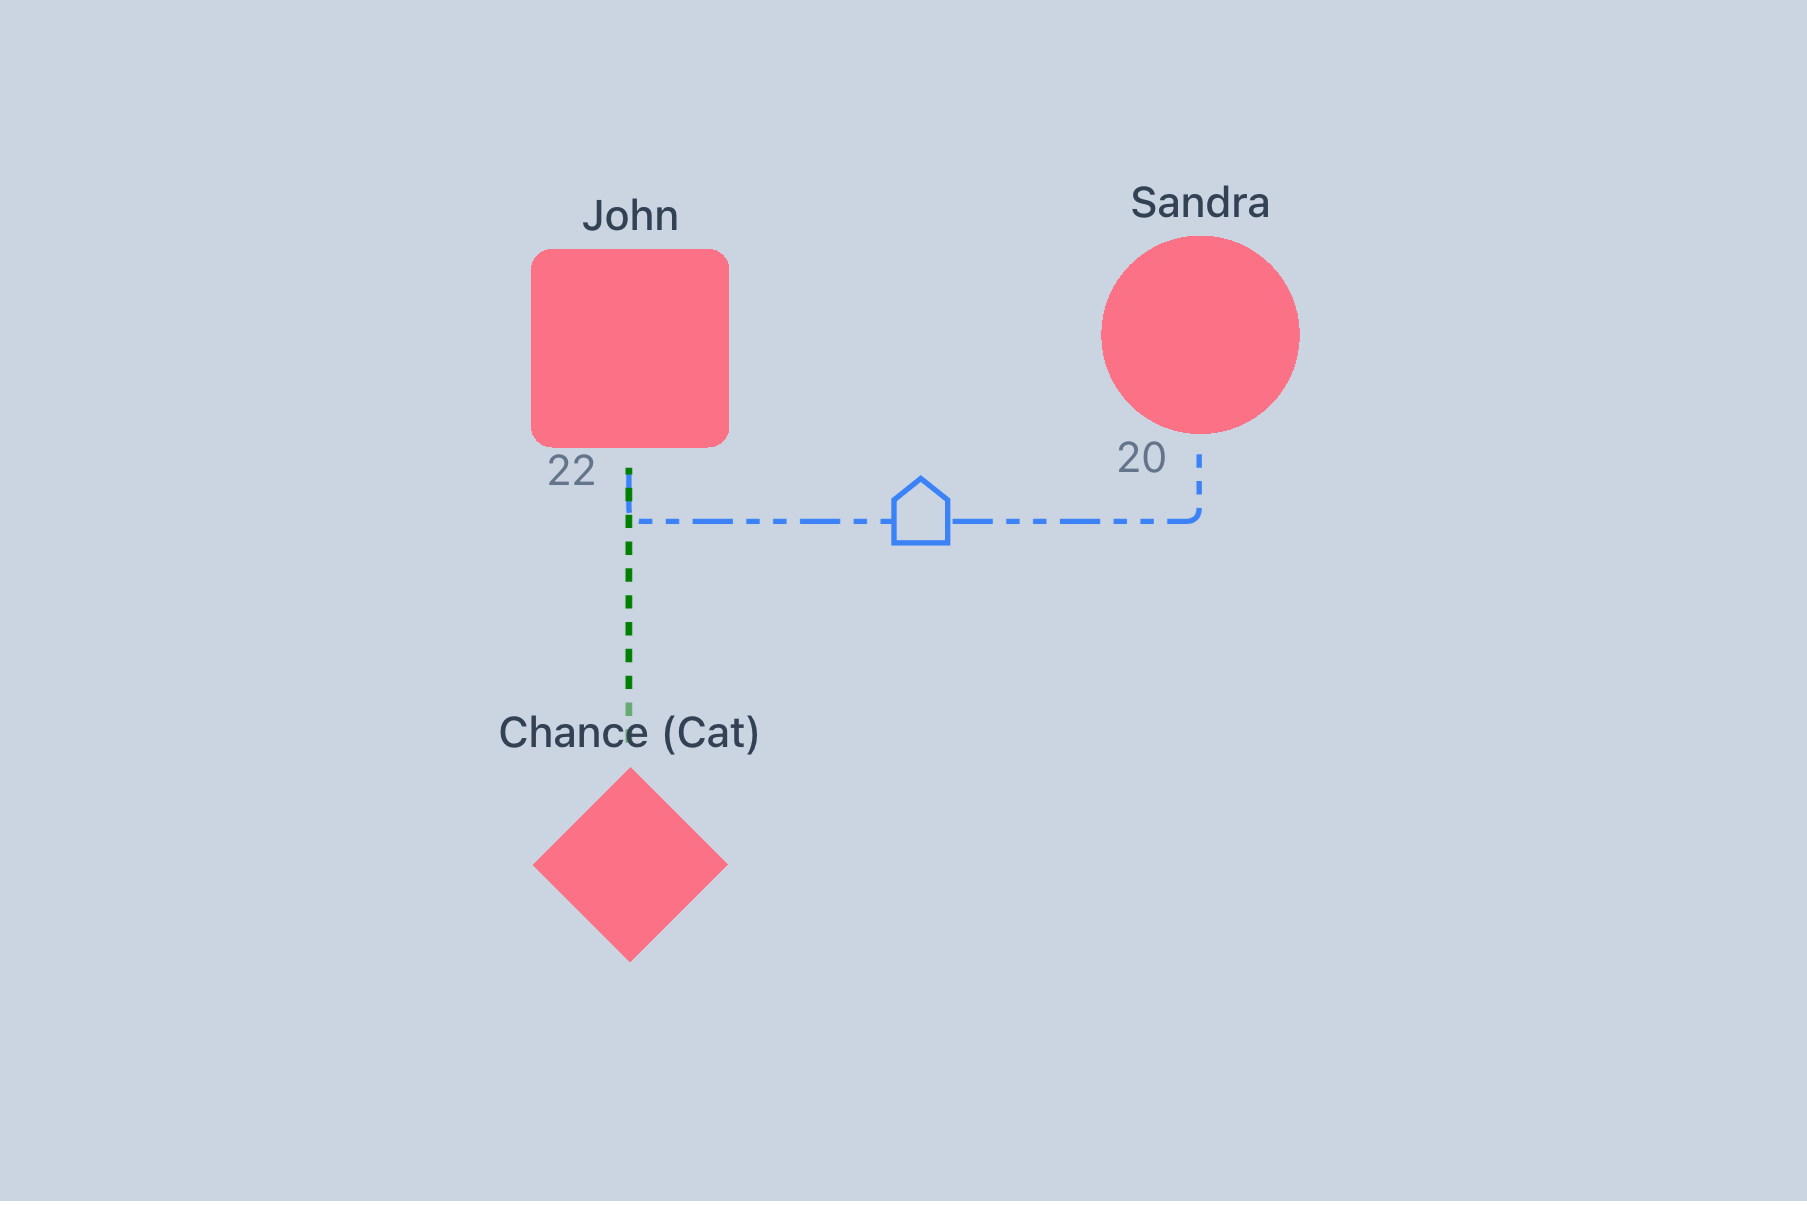
In the following example, Chance is John's cat, whom he adopted before meeting his partner Sandra. Although the couple are cohabiting and therefore live in the same house, John is Chance's primary caregiver and is therefore connected directly to him.
- Label clearly. Add the pet’s name and species above or inside its node for quick reference. You can see this has been illustrated in the two examples above.
Step 6 - Show Emotional and Other Connections
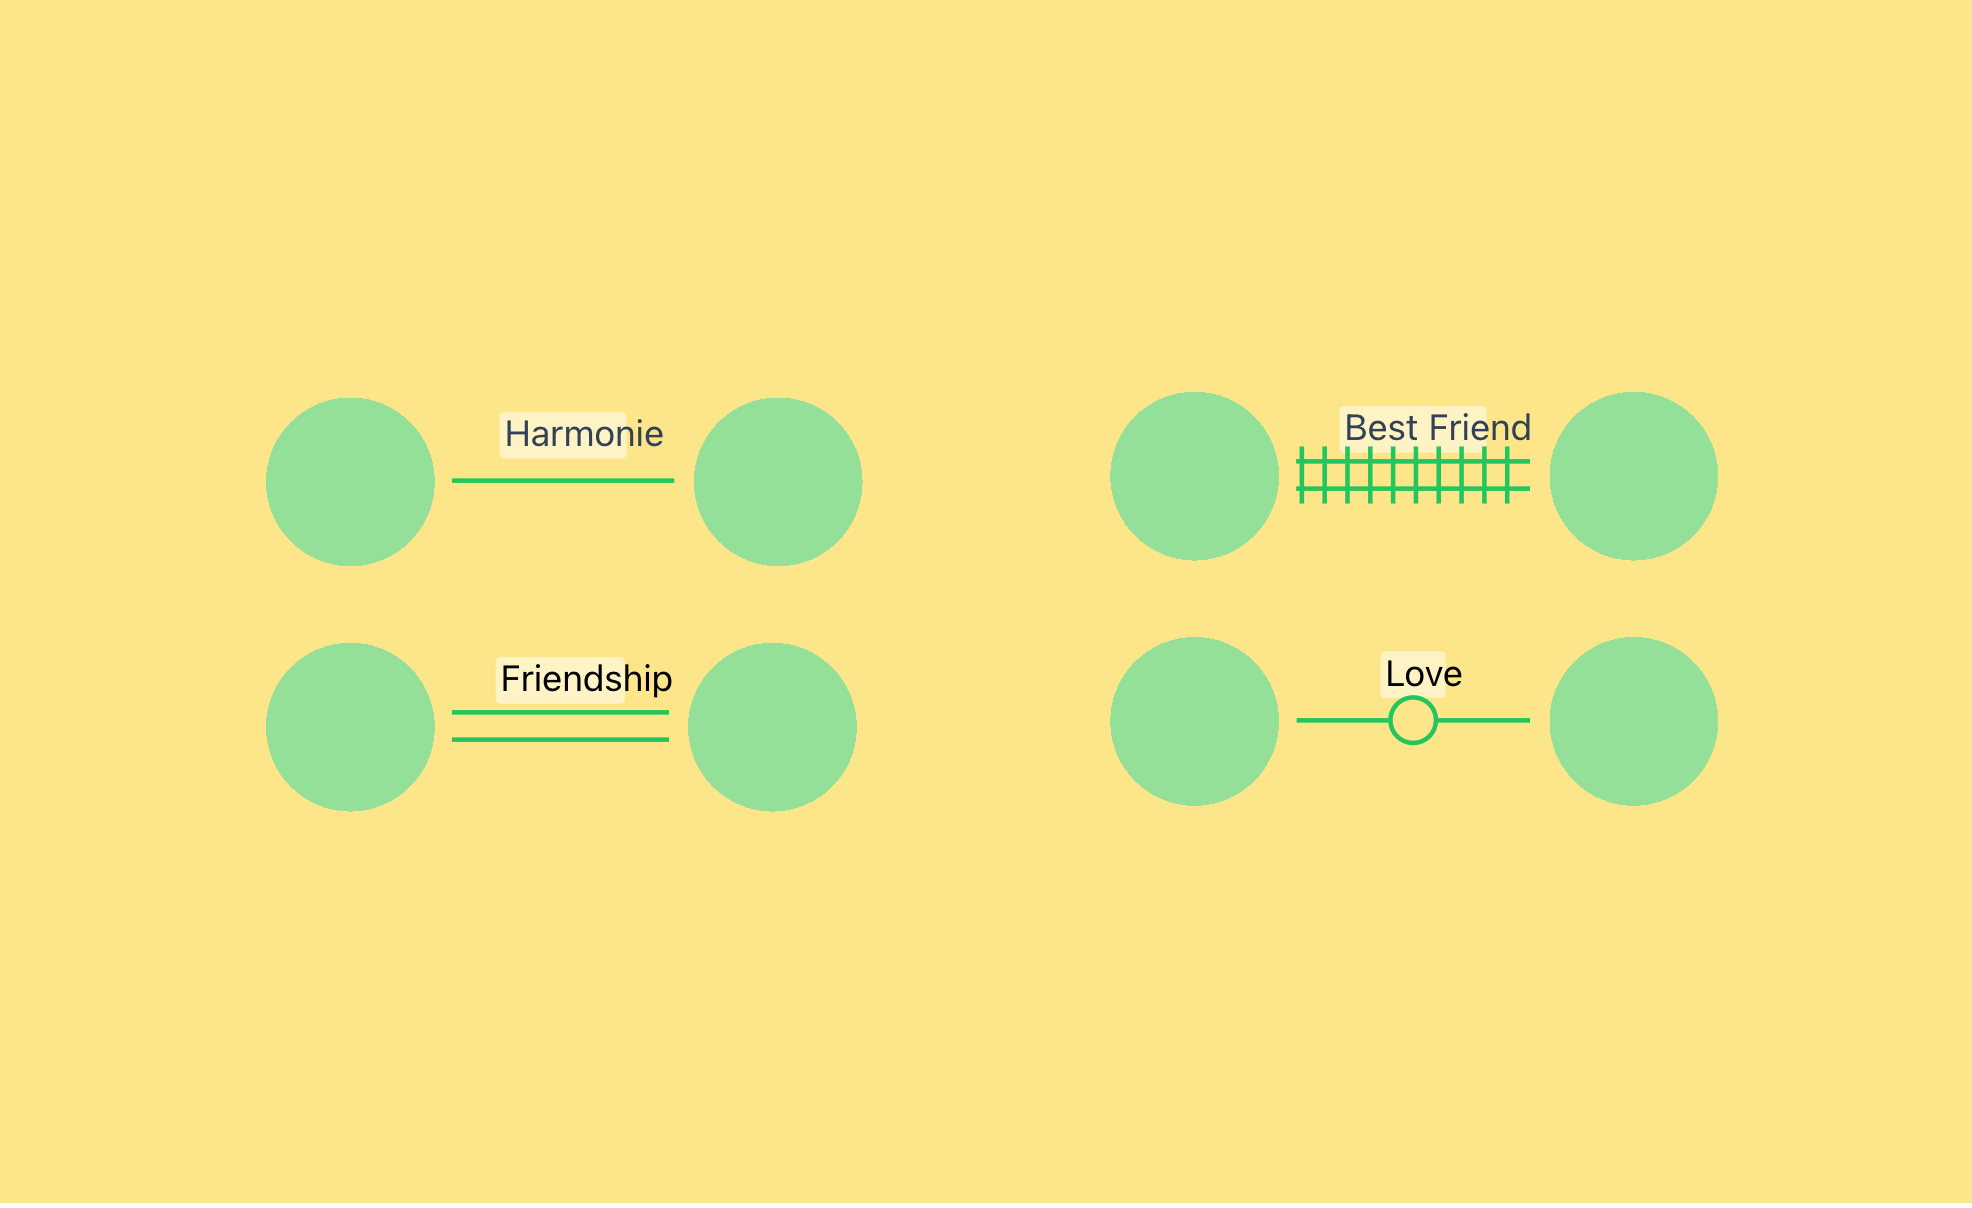
- Draw emotional lines between any two people. Unlike the relationship lines (which go under the couple’s symbols), emotional connection lines go between symbols to show relationships (friendly, close, distant, or conflict).
Here are some examples of some positve emotional connections:
Some emotional relationships may be more difficult, such as:
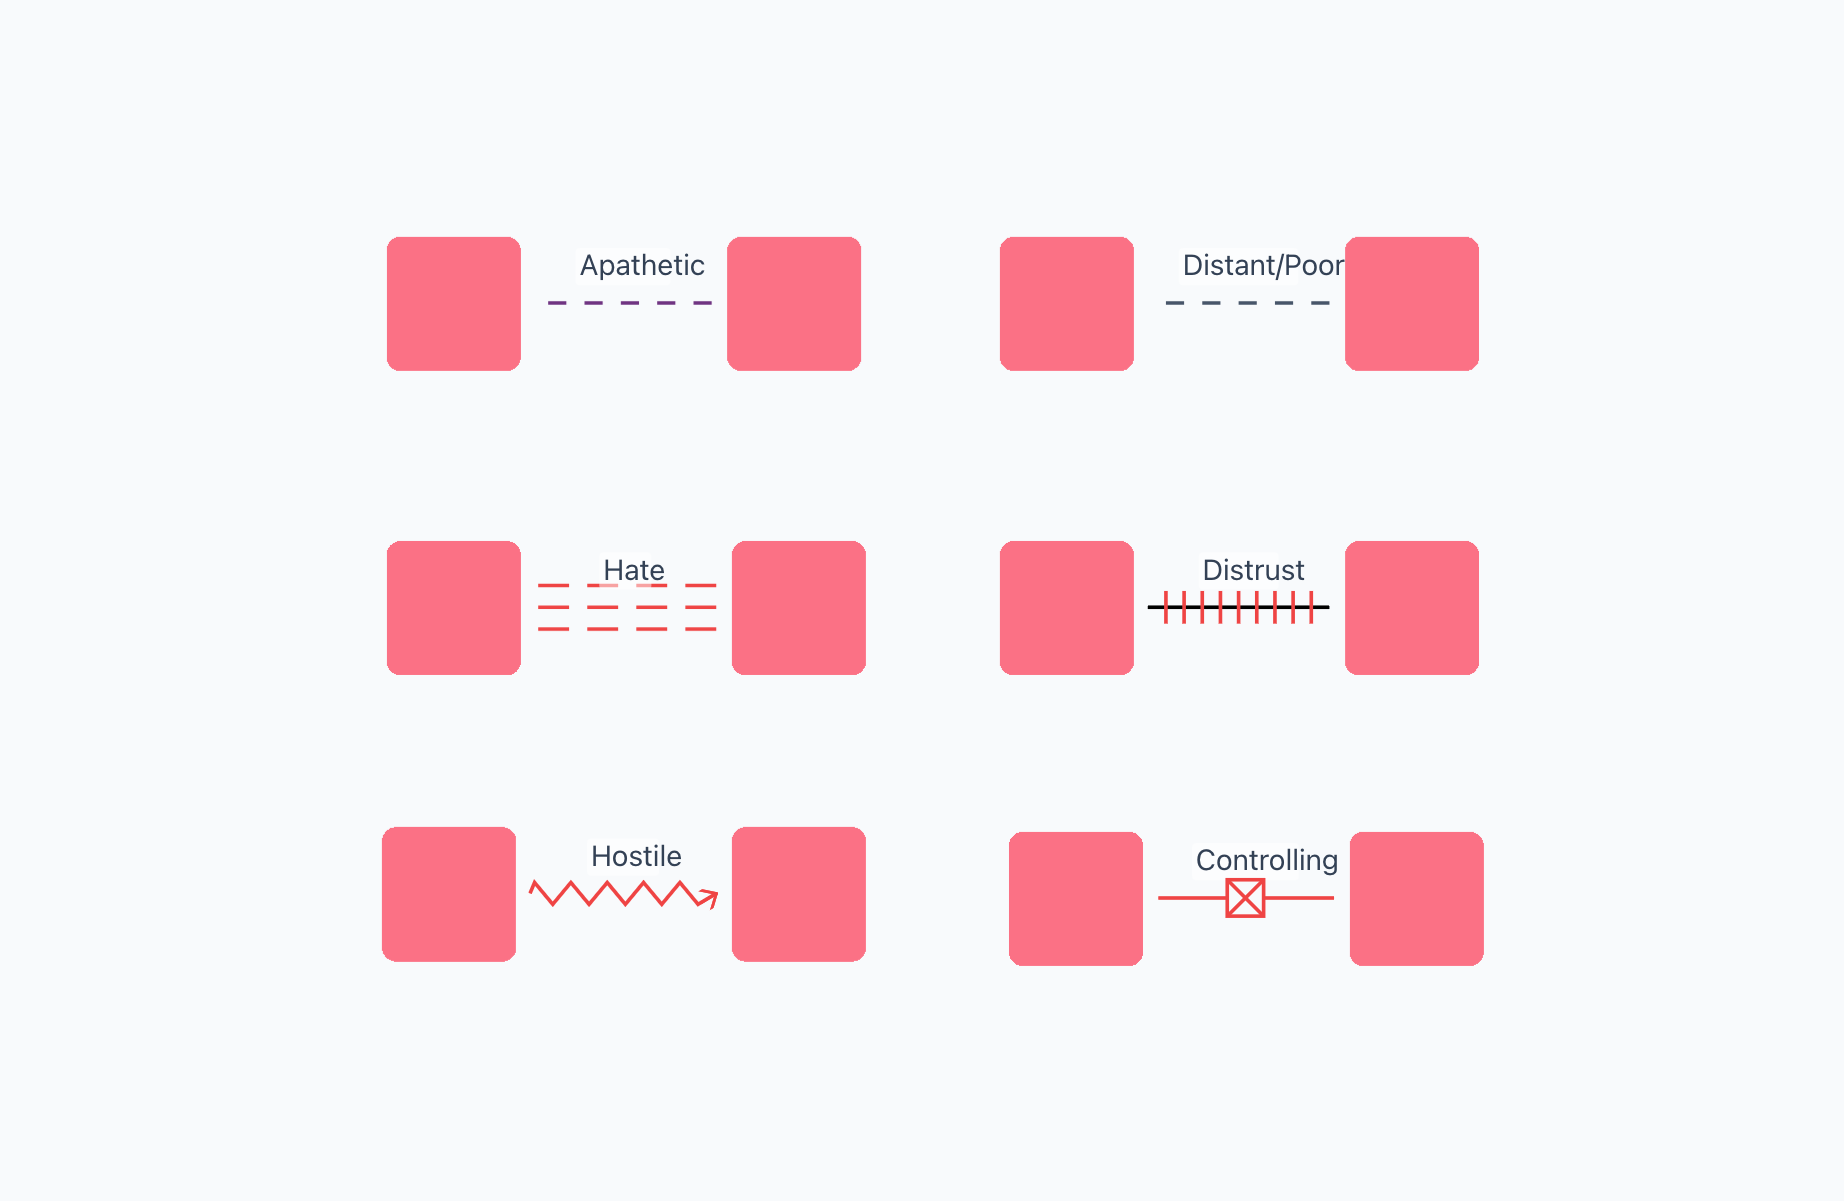
- Be mindful that if you create emotional lines between all the nodes in your genogram, it can look cluttered and may be confusing. If this is the case, you can choose to select any connections that you feel are particularly important or impactful.
Connecting the dots - A Genogram Example
Now that you're aware of each step - from gathering family information and drawing nodes, to mapping relationships, generations, pets, and emotional ties - let’s walk through a detailed example. You’ll see how these symbols and rules combine into a complete genogram that tells a rich, visual story of one family’s journey.
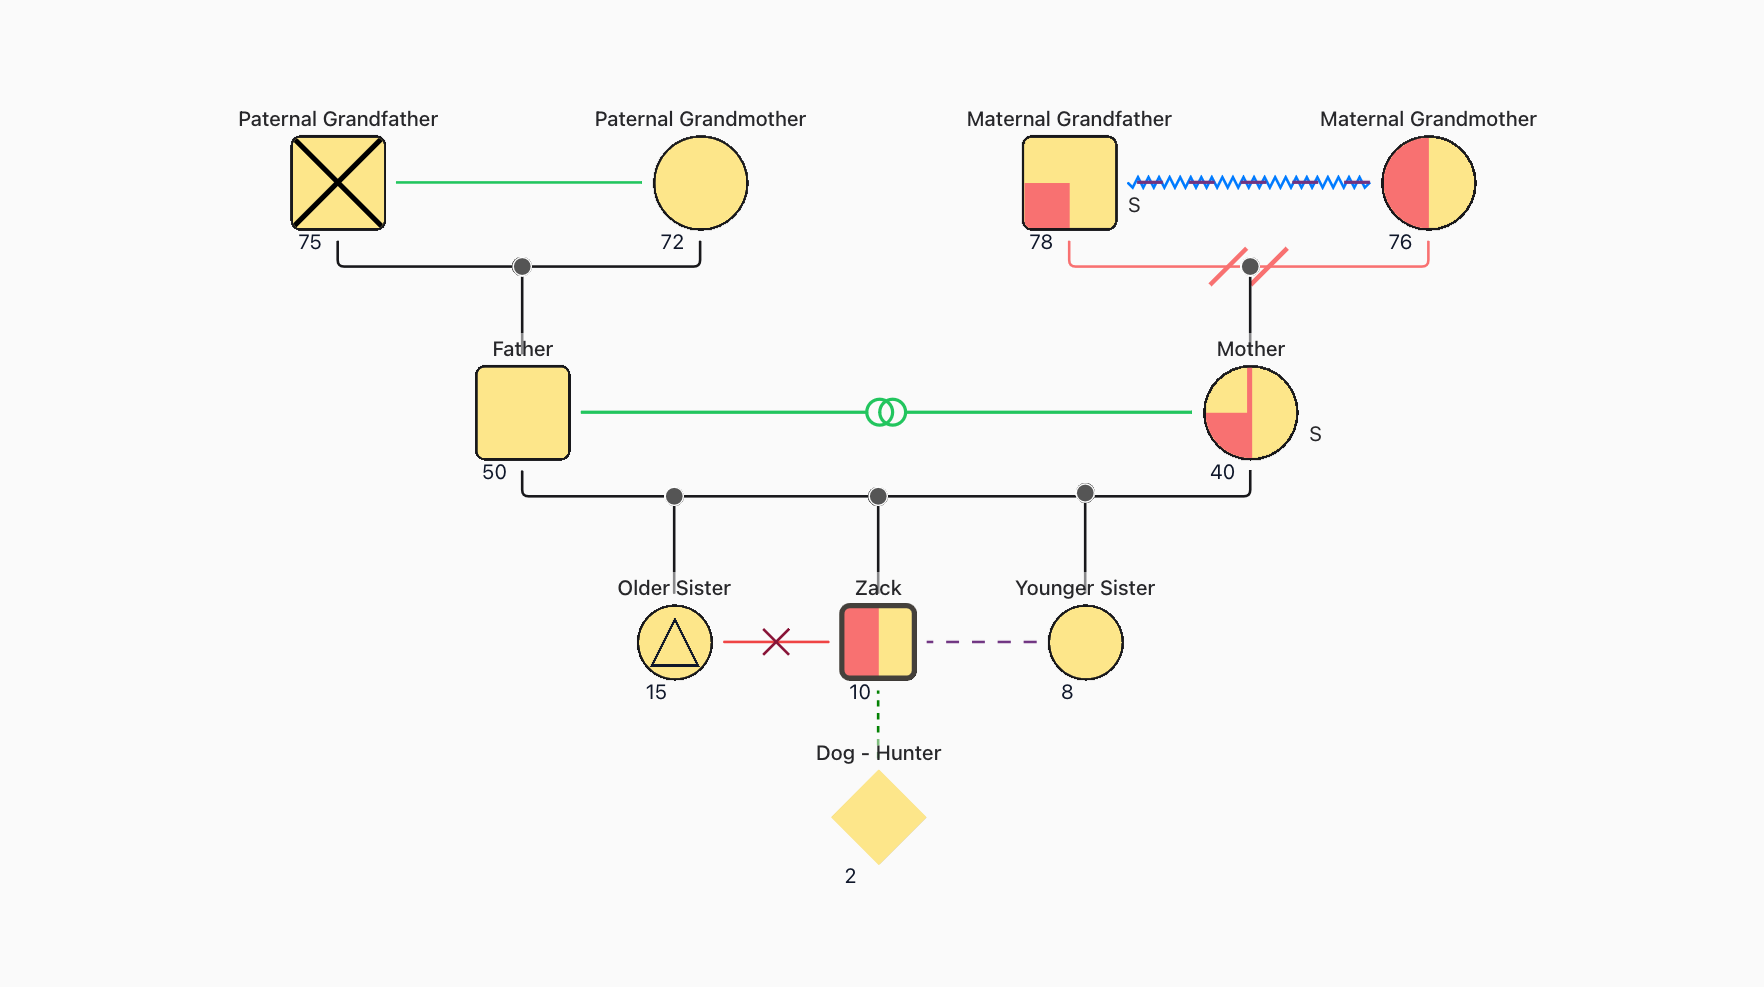
Genogram Example Explained:
In this genogram, the thick black border around Zack’s node marks him as the main subject. His node is half‑filled in red to show he’s experiencing anxiety and depression. Below Zack, Hunter the dog is linked to him with a dotted line - his parents brought Hunter in to support Zack’s mental health.
On Zack’s sibling level, his older sister appears to his left with a triangle inside her circle, indicating she identifies as a lesbian. A jagged “manipulative” line connects her to Zack, reflecting his view that she often lies to get him into trouble. To Zack’s right is his younger sister, joined by a flat “apathetic” line since Zack feels no real connection or interest in her.
Moving up a generation, Zack’s parents are joined by a solid “in‑love” line to show a happy marriage. His mother’s node carries an “S” for smoker and a remission symbol for her recent battle with cancer - factors that may have contributed to Zack’s own struggles.
At the top, Zack’s maternal grandparents are shown side by side, with a slash through their marriage line indicating divorce. His grandfather struggles with alcoholism (marked by a small red square) and has perpetrated physical abuse (represented by a blue jagged line) toward his grandmother. This has contributed to her depression (shown by a half‑filled red node), suggesting a possible generational pattern of mental health difficulties.
On the opposite side, Zack’s paternal grandfather is marked with a black cross to indicate he’s deceased, while his grandmother, age 72, remains on the chart with a solid line signifying their harmonious marriage.
This example spans three generations and combines emotional connections, health markers, and life events to illuminate factors that may be influencing Zack’s mental health journey.