

Genogram5 Genogram Examples and How to Make Them

Need help getting started on your genogram journey? It can feel confusing at first, but nothing beats seeing real examples. Explore five different family setups - from basic nuclear to blended-families and get inspired to map your own.
A genogram is like an advanced family tree that shows not just who is related, but how they interact. It uses simple symbols – squares for males, circles for females – and connecting lines to map relationships. Genograms can include facts (like birthdates) and even patterns (like health or behaviour issues), helping to “identify recurring themes and patterns across generations” (Boardmix, 2024).
Therapists, social workers, doctors and curious families use genograms to understand family dynamics and spot communication or health issues (Marschall, 2024). For example, a solid line between two shapes means marriage (or partnership), while a double slash through that line marks a divorce.
Here are five step-by-step genogram examples, from simplest to most complex, with tips on drawing each one.
1. Simple Nuclear Family
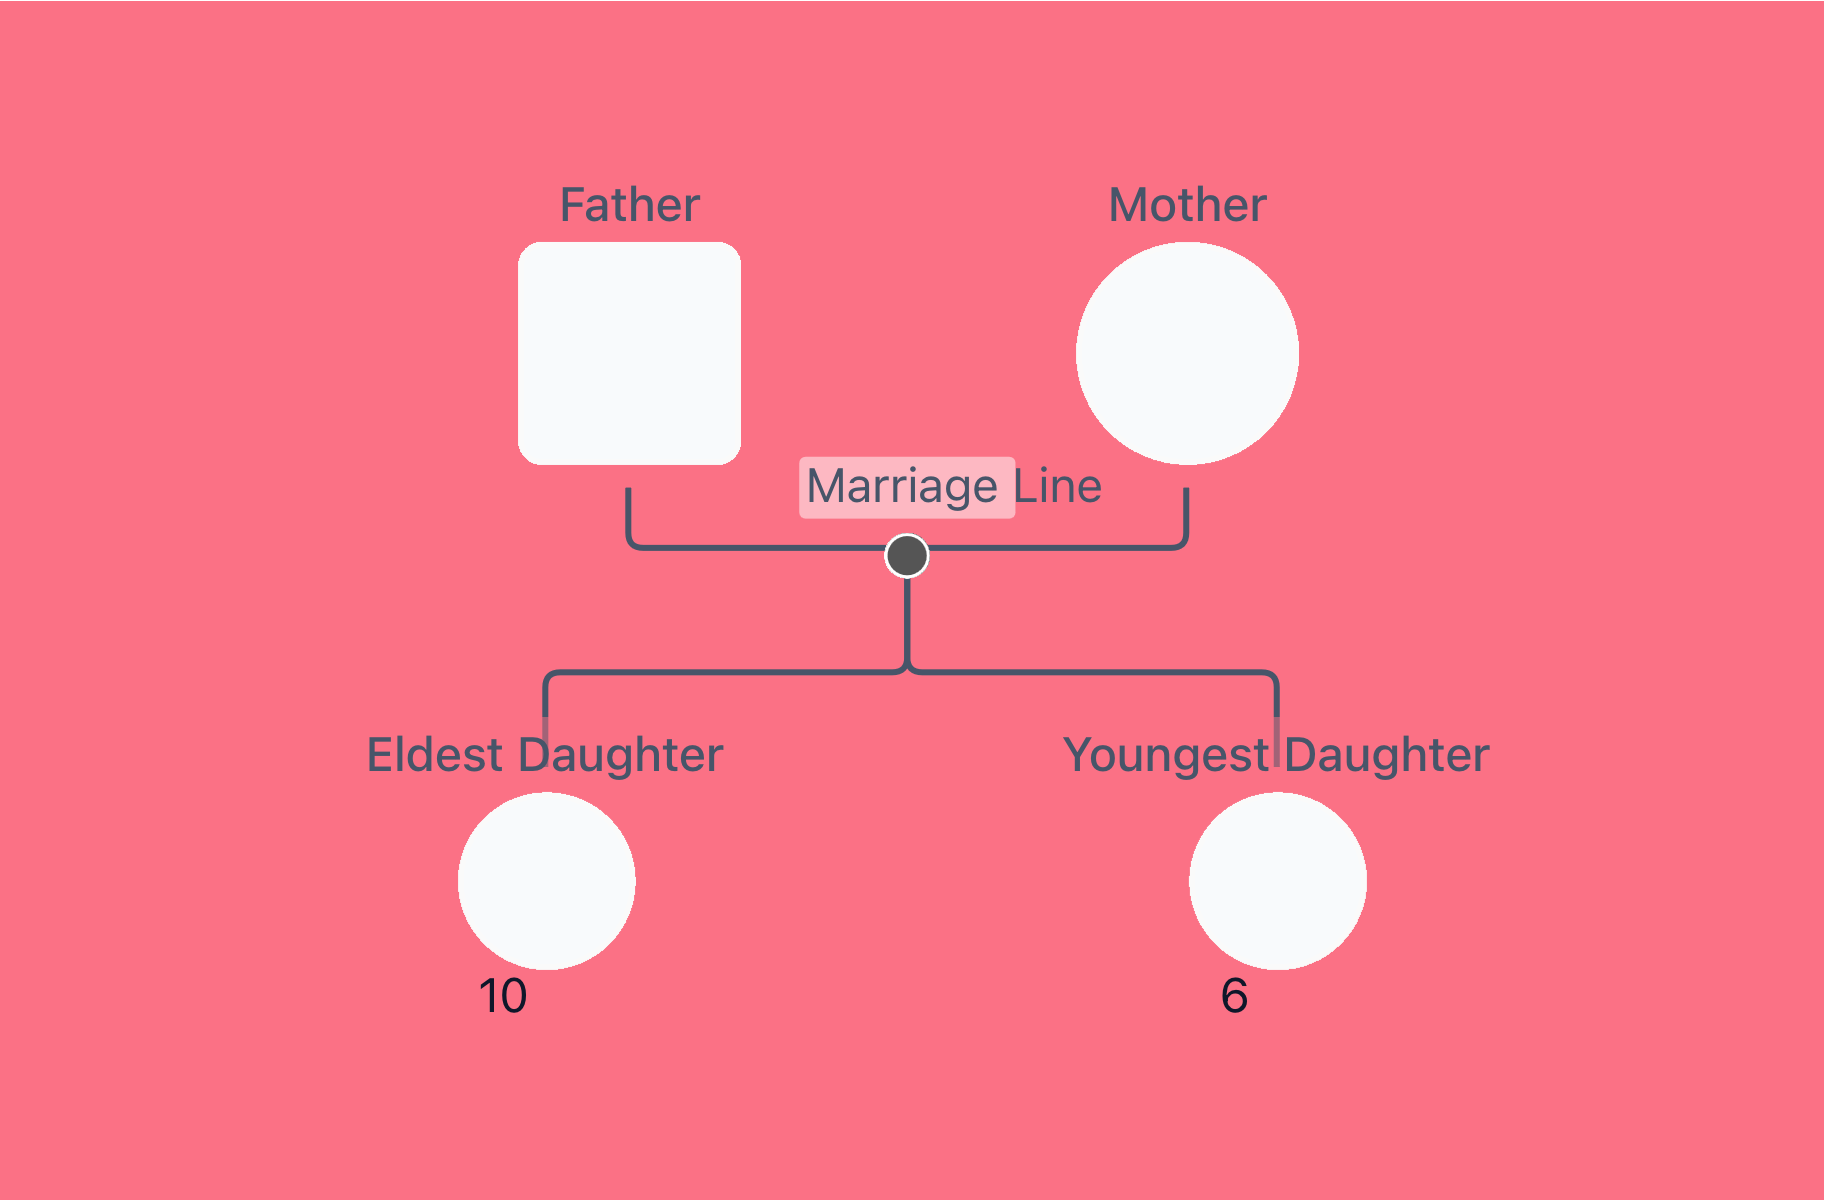
In a basic nuclear family, two parents are married and have children. To draw this: put the father’s square to the left and the mother’s to the right, connected by a solid straight line indicating marriage. Then draw vertical lines down to each child (squares for sons, circles for daughters). This shows they are biologically related and live together. For example:
- Father and mother: A square (father) and circle (mother) connected by a solid horizontal line means they’re married.
- Males are placed on the left of females.
- Children: One vertical line goes down to each child’s symbol. For instance, two downward lines to two circles would show two daughters (or to squares for sons).
- The children's symbols can be slightly smaller than their parents.
- Place the children from eldest (on the left) to youngest (on the right)
Genogram Example 1: Basic nuclear family genogram. Two parents (square and circle) connected by a marriage line, with lines down to their two daughters.
2. Extended Family
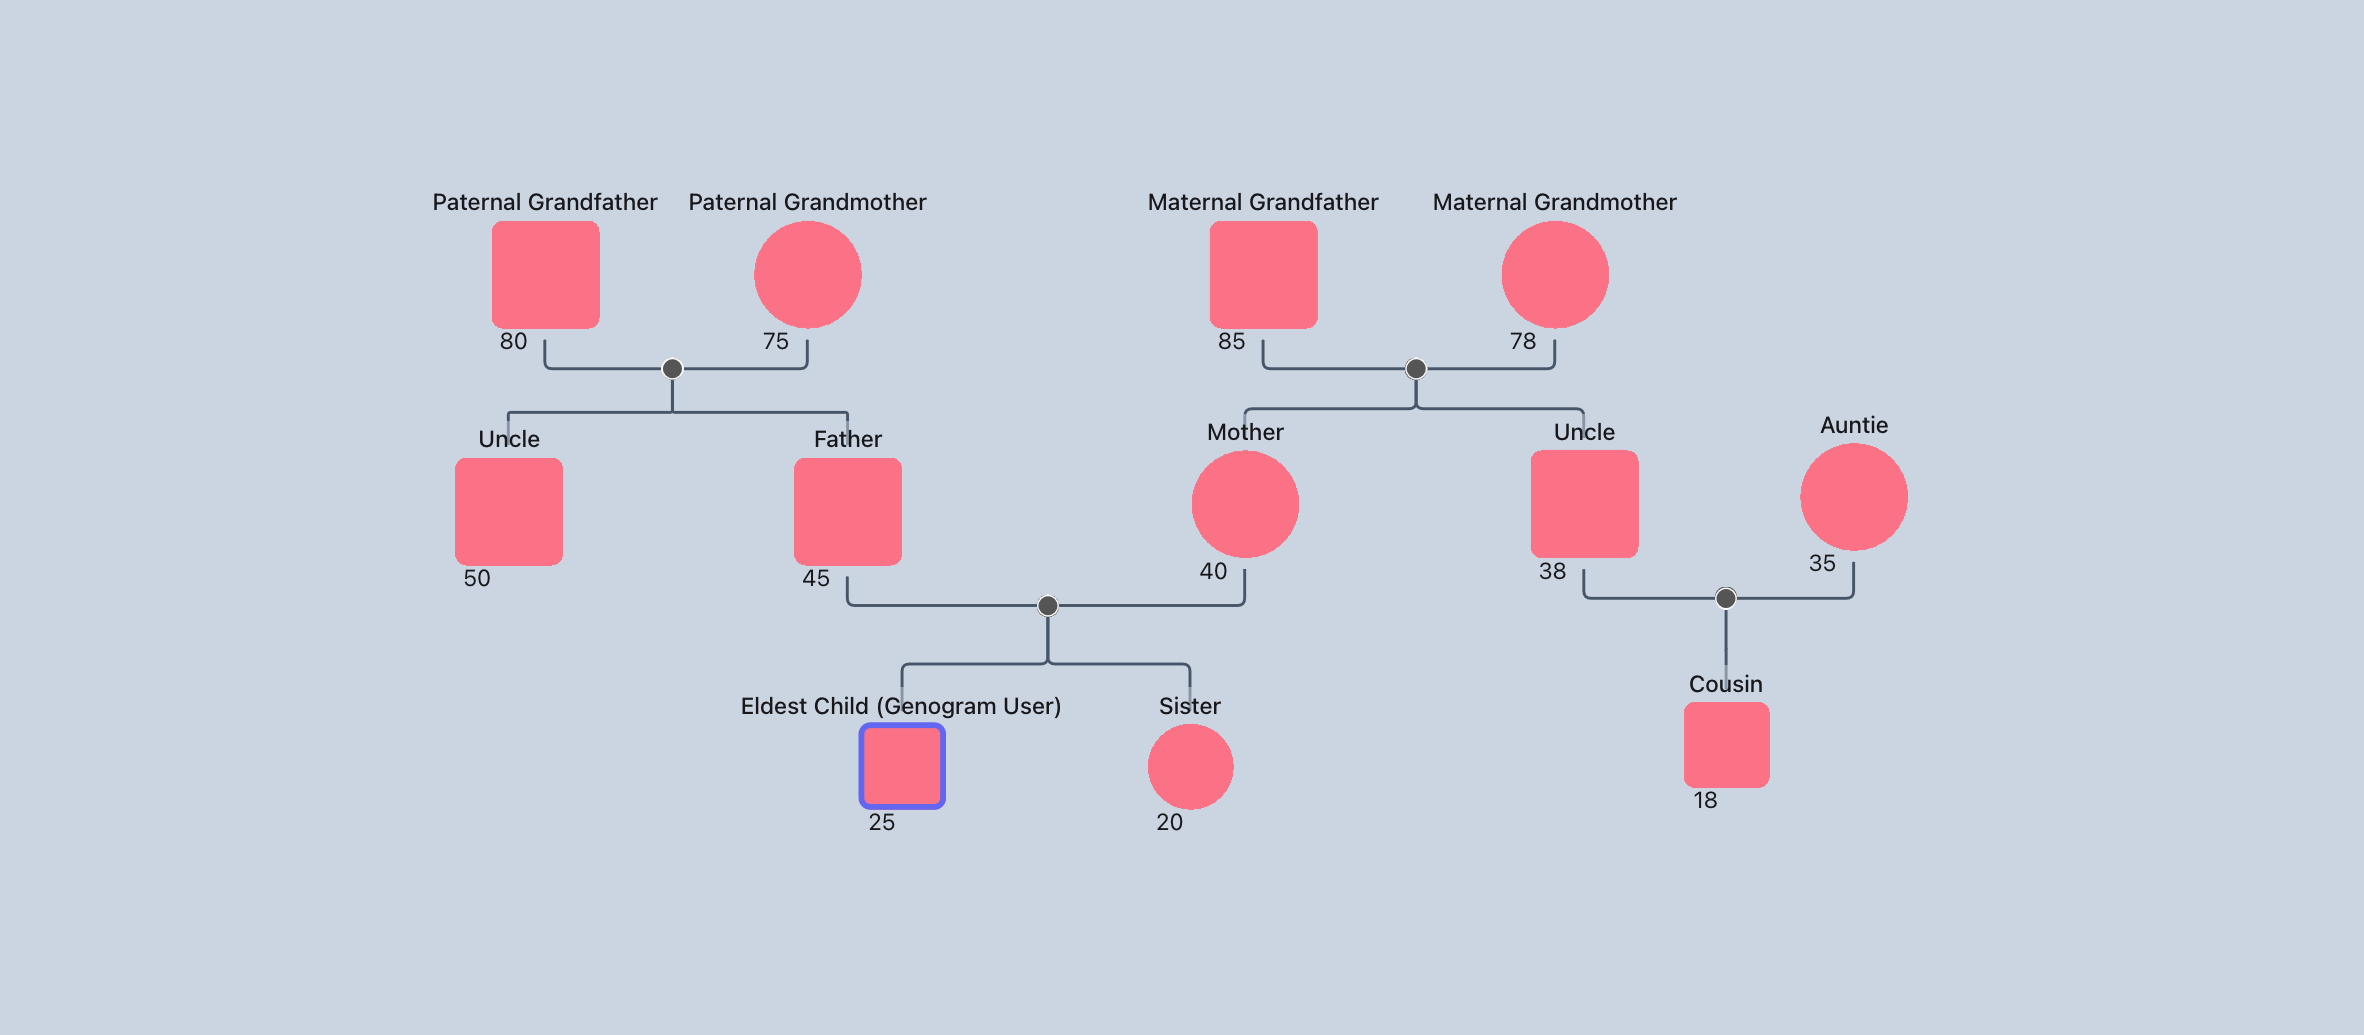
To extend the genogram, include the parents’ siblings and their children. Place each child’s sibling (the aunt or uncle) on the same level as the parent they share, and connect siblings with a horizontal line (they share the same parents). Then draw vertical lines down to their children (the cousins). For example:
- Grandparents at top: You might start with the grandparents (one square + one circle) connected by marriage.
- Siblings: Below them, draw their children (for instance, father and his sister) on the same horizontal level and connect them with a sibling line or just place side by side.
- Aunts/Uncles: If the father has a sister, draw her circle on the same line as the father’s square. She may have a partner (connect with a marriage line) and children.
- Cousins: From the aunt’s/uncle’s symbol, draw vertical lines down to represent their kids (these are the first cousins of your main subject).
No divorce or remarriage is shown in this example. All lines are solid, showing stable marriages. You can add labels or ages outside the symbols if you like.
Genogram Example 2: Extended family genogram. Parents have siblings on their level, with lines down to each sibling’s children (the cousins). The paternal uncle never married or had children, therefore he is depicted alone.
3. Showing Marriage and Divorce
Relationships aren’t always simple—and genograms can help make sense of that complexity. When it comes to marriage, divorce, and remarriage, it’s important to represent these clearly, so the overall picture stays easy to follow.
Here are some general tips for drawing marriages and divorces on a genogram:
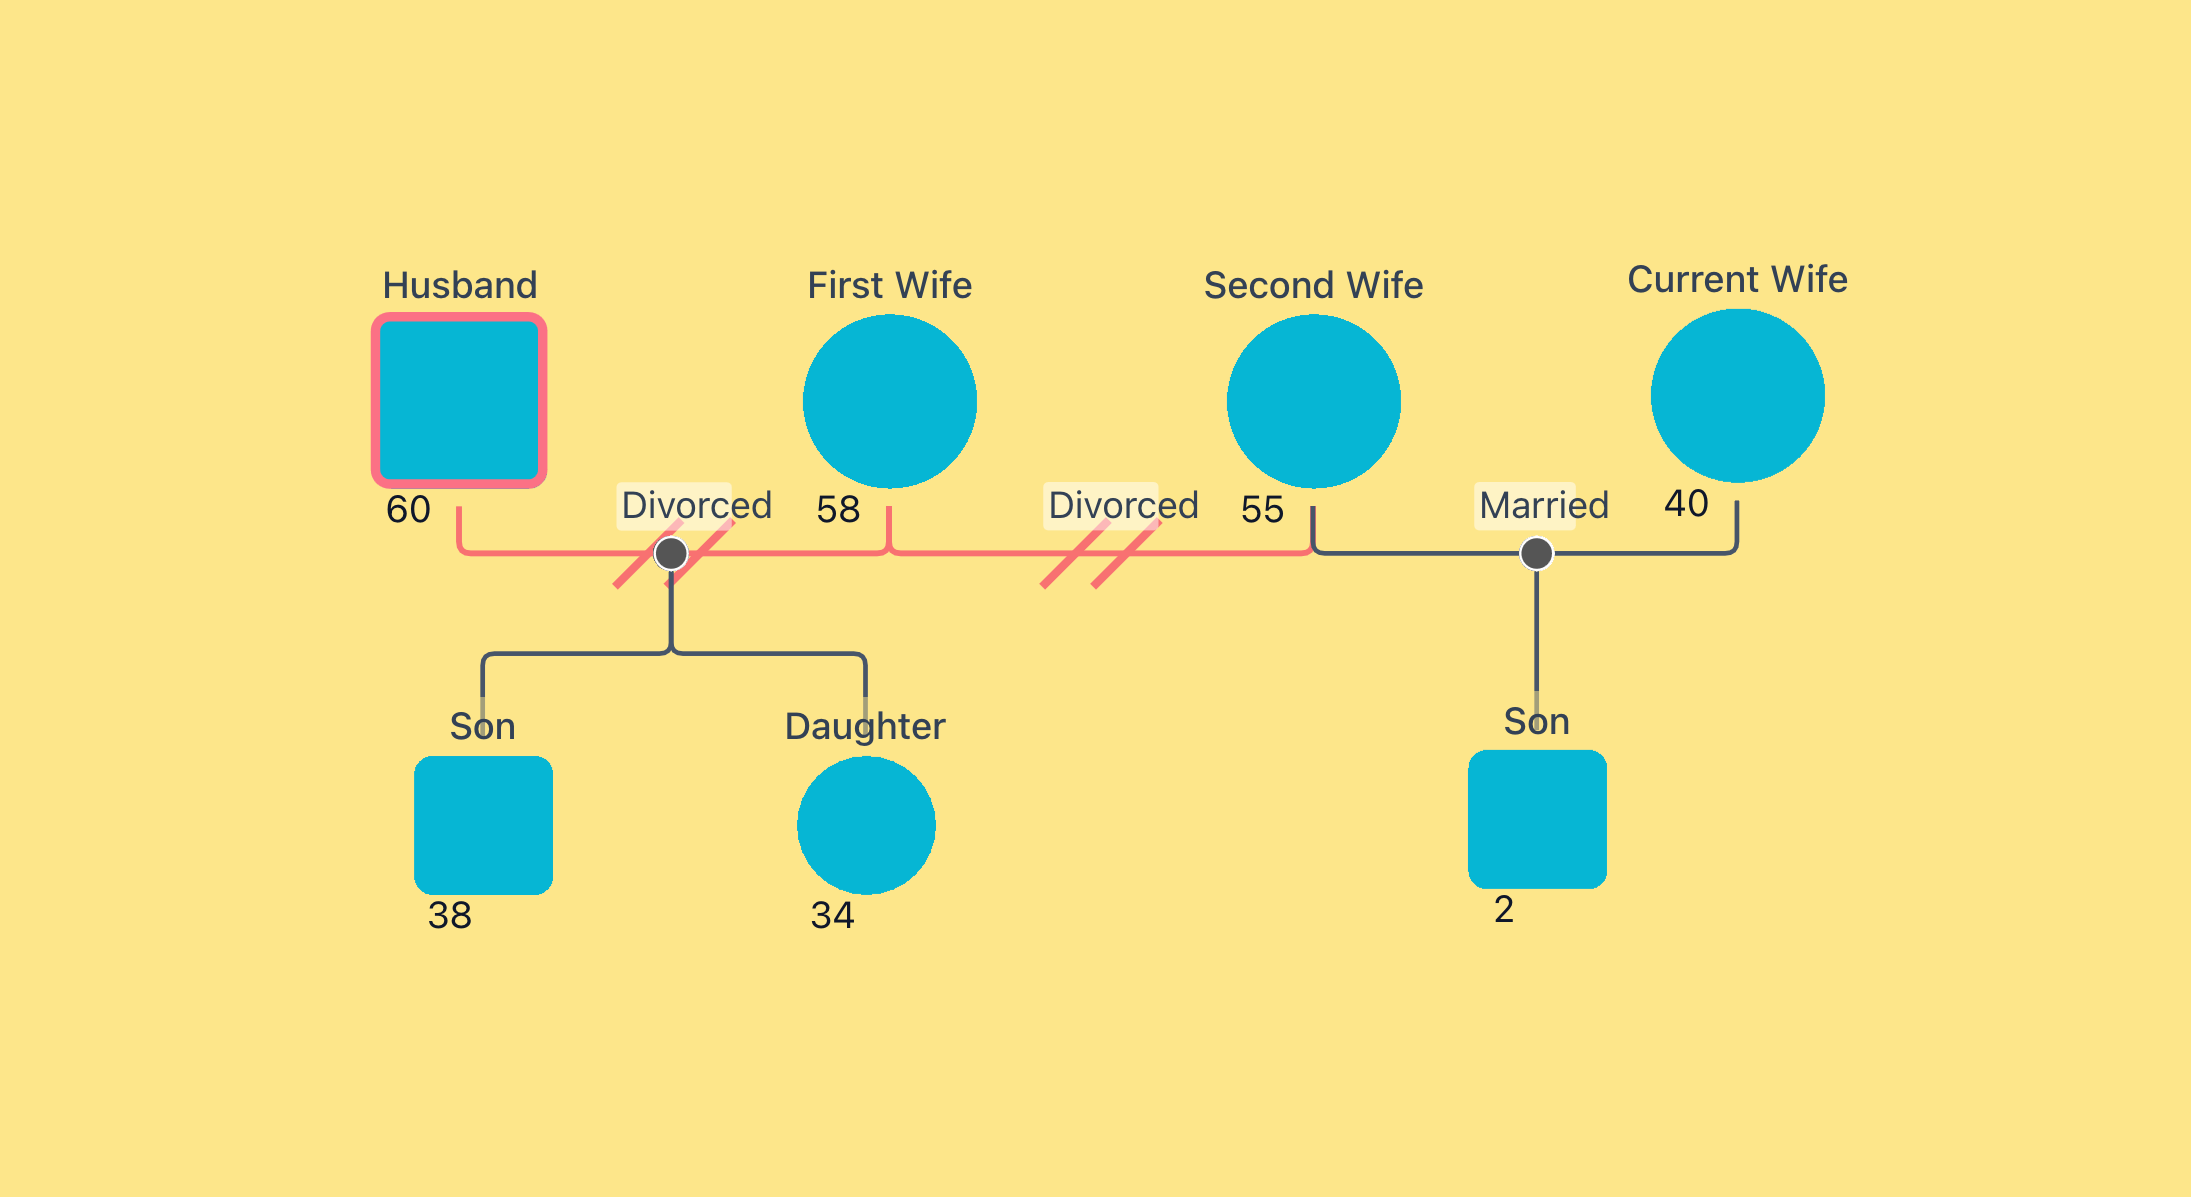
- Order of relationships matters: When someone has had more than one marriage or long-term partner, show these connections from left to right in the order they occurred. This helps tell the story over time. Although you may have to play around with this in larger, more complex genograms, it can depend on the main subject and the purpose.
- Use spacing to keep it clear: When showing multiple relationships for one person, make sure each partner is spaced out enough to avoid a tangle of lines. You can always extend the diagram horizontally if needed.
- Label if helpful: If your genogram includes several marriages or overlapping timelines, it can help to label each partner (e.g. “First Wife,” “Current Partner”) or include dates of marriage/divorce underneath the line.
- No need to delete past relationships: A genogram isn’t about showing just the present—it captures a person’s history. So even if someone is no longer married, it’s still important to show that relationship.
Genogram Example 3: In the figure below, the husband (age 60) has three wives, shown from first to current. He has two children from his first marriage, one from his current marriage and none from his second.
4. Representing Half-Siblings
Families can be complex, and genograms are a great tool for visually representing those complexities. When a child has half-siblings (siblings with whom they share only one biological parent), it's important to represent each parent’s relationships and children clearly.
Here are some general tips when drawing half-siblings in a genogram:
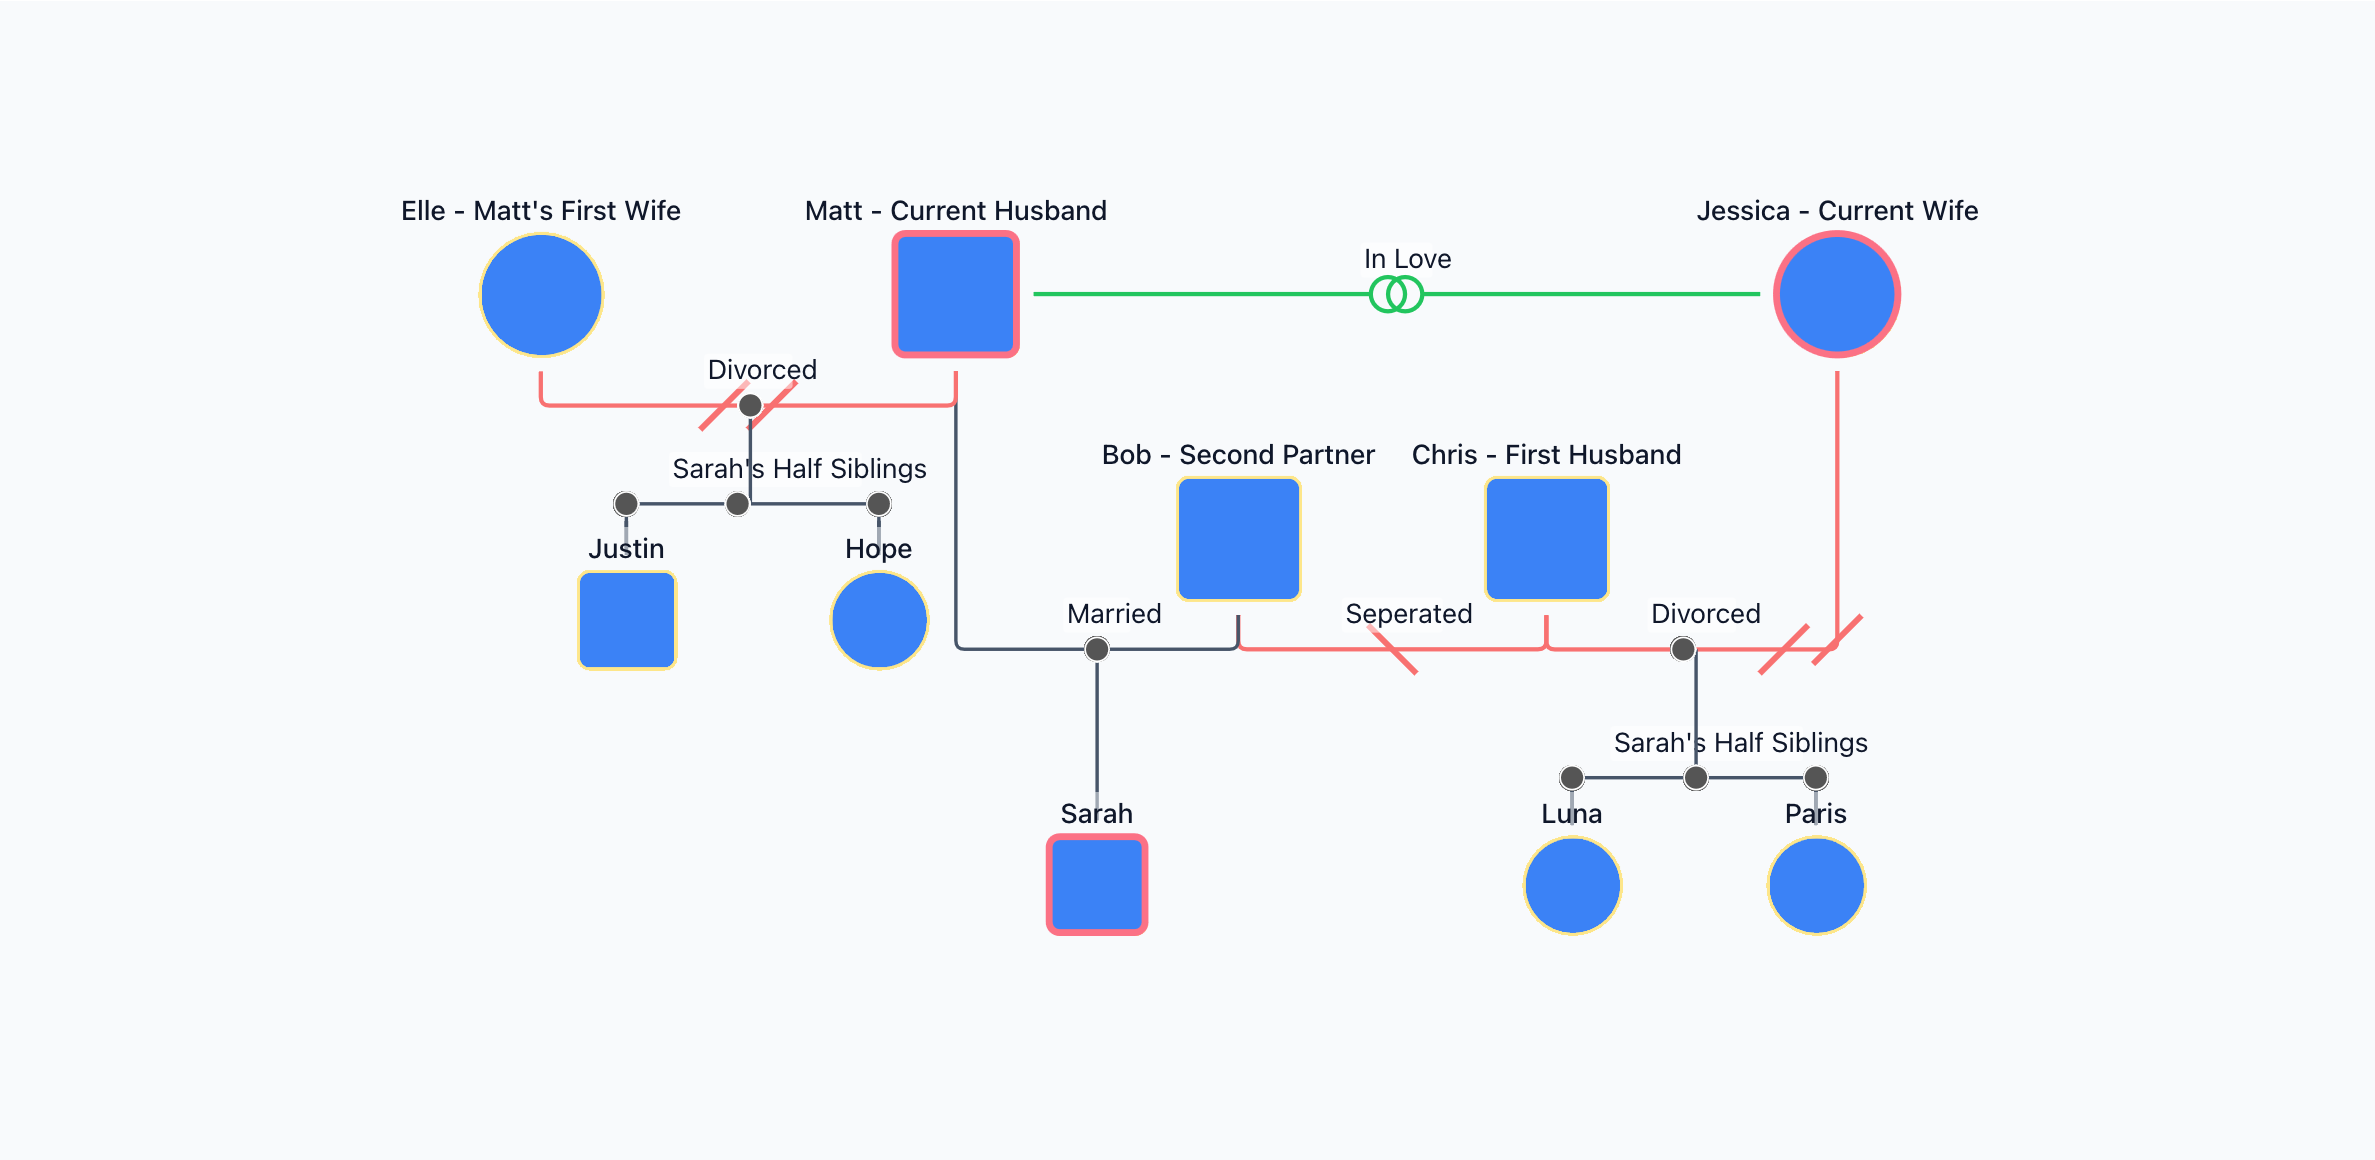
- Use separate relationship lines to represent each of the parent’s past or current partners. Marriages are shown with a solid horizontal line; cohabiting relationships can be shown with a dotted or dashed line.
- Indicate divorce or separation with double slashes (//) through the horizontal line.
- Place children below the line connecting their biological parents, even if those parents are no longer together.
- Label each relationship clearly, this can help when reviewing the genogram with others or writing supporting documentation.
Genogram Example 4: The genogram below focuses on Sarah as the main subject. Her father, Matt, was previously married to Elle, and together they had two children: Justin and Hope. Sarah's mother, Jessica, was previously married to Chris, with whom she had two daughters: Luna and Paris. After separating from Chris, Jessica had a long-term relationship with Bob, though they never married and had no children together.
Sarah is the only child from the relationship between Matt and Jessica.
This means Sarah has four half-siblings in total: two from her father's side (Justin and Hope) and two from her mother's side (Luna and Paris). She has three half-sisters and one half-brother. Each of these relationships can be clearly represented on the genogram by placing the children under their respective biological parent pairings.
5. Adding Step Siblings
Creating a genogram that includes step-siblings can be a helpful way to clearly map out complex family dynamics—especially in blended families. Here are a few tips to guide you:
- Show each parental relationship separately: This helps distinguish between biological, step, and marital connections.
- Use labels to indicate step-relationships when a person is not biologically related to the main subject.
- Include biological parents of step-siblings if known, to give full context and clarify their position.
- Always identify the main subject (the person the genogram is about) with a different coloured and thicker line around their node.
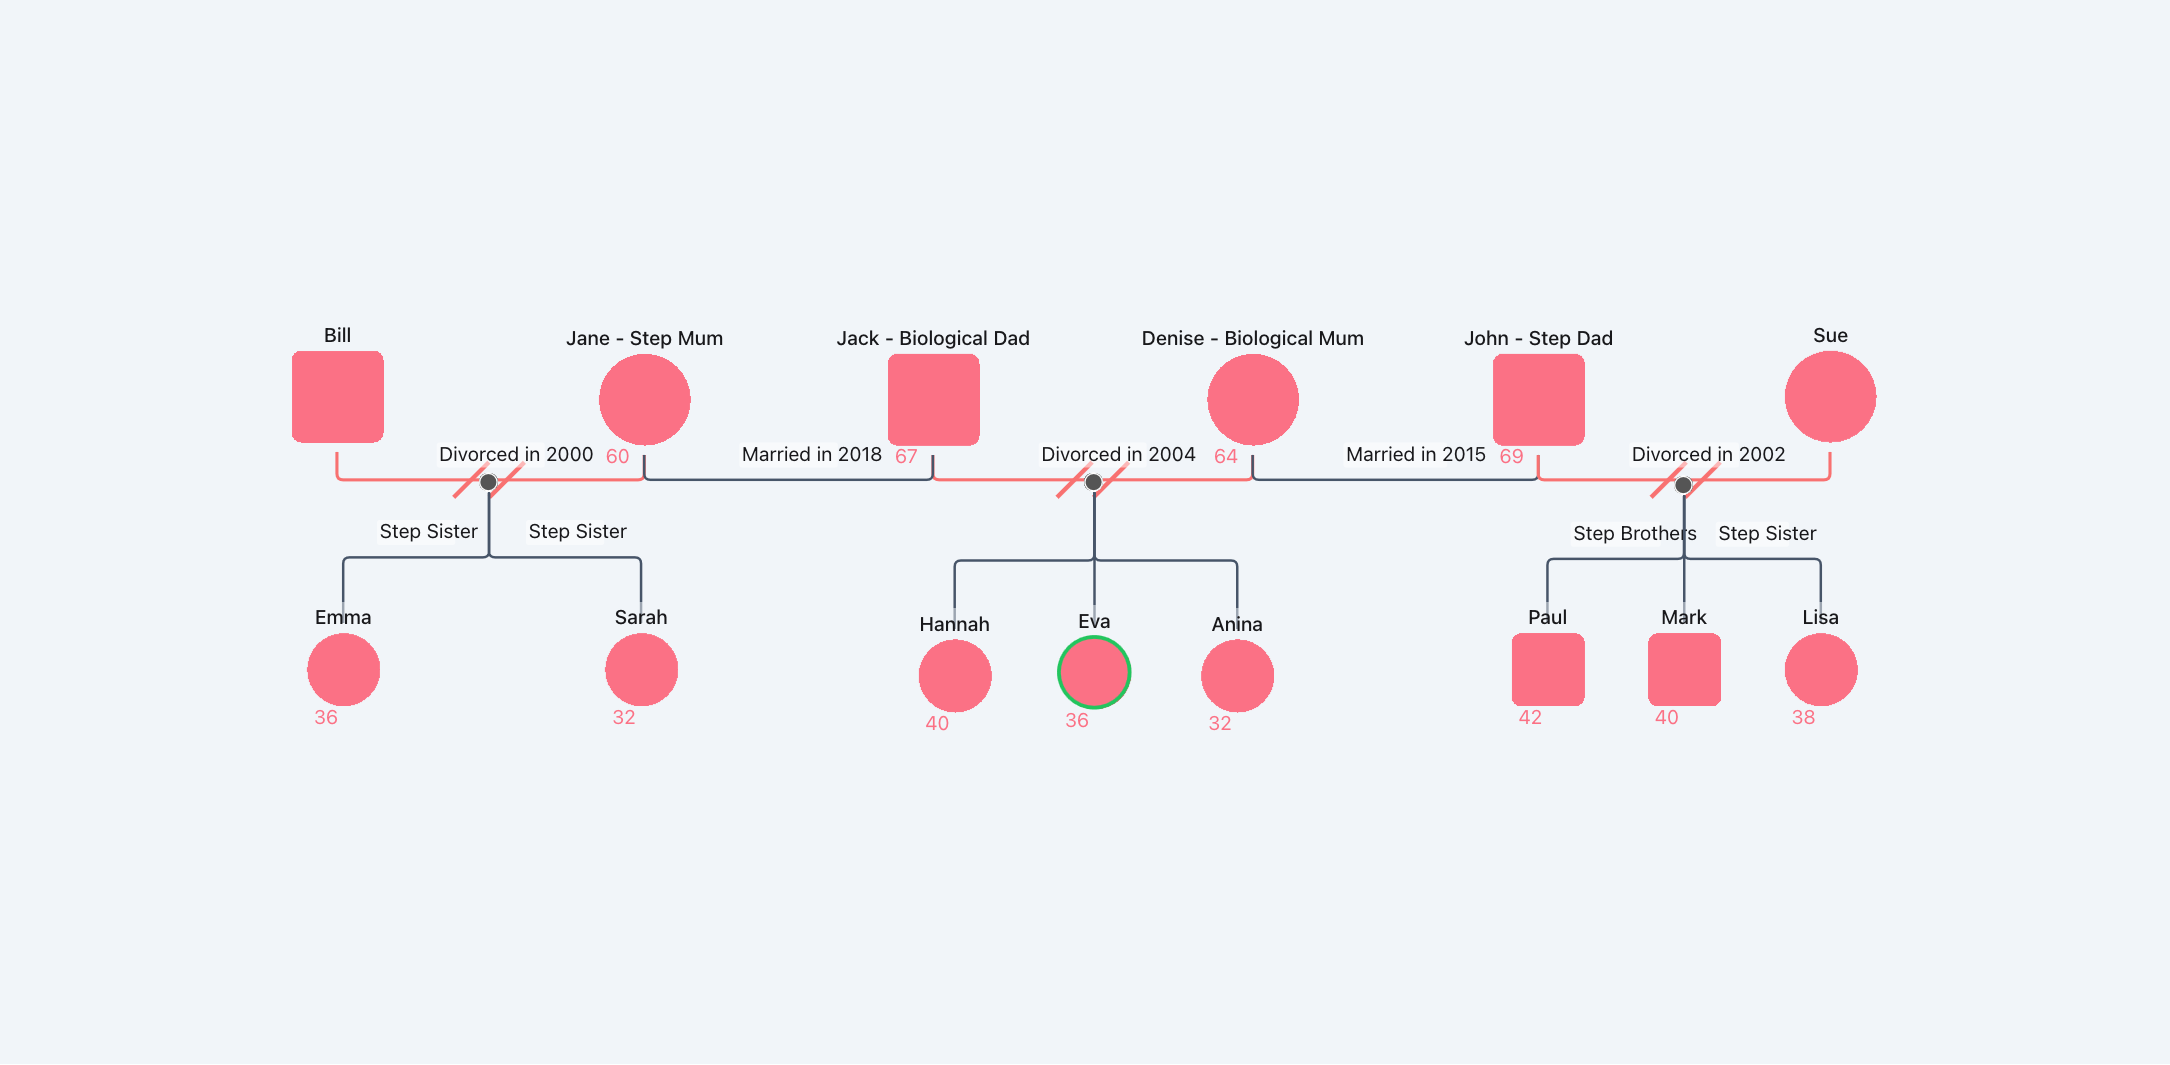
Genogram Example 5: The genogram below focuses on Eva as the main subject. Her biological parents divorced in 2004. Eva is the middle child of three siblings and had an older sister named Hannah and a younger sister named Anina.
Following the separation, Eva’s mother remarried John, who had three children—Paul, Mark, and Lisa—from his previous marriage to Sue. Eva’s father also remarried; his new wife, Jane, had two daughters—Emma and Sarah—from her previous marriage to Bill.
This means Eva has five step-siblings in total: three from her mother’s side (Paul, Mark, and Lisa) and two from her father’s side (Emma and Sarah). Each of these relationships can be clearly represented on the genogram by placing the children under their respective biological parent pairings, with Eva, Hannah, and Anina shown under their biological parents, and step-relationships indicated using clearly written labels.
Wrapping It All Up
By now, your head might be spinning a little—and that’s totally okay! Genograms can seem a bit overwhelming at first, especially with so many different family setups and ways of drawing them. The truth is, there’s no single “right” way to do it. The examples I’ve shared here are methods I’ve developed over time that feel clear, logical, and easy to follow.
There are plenty of resources out there, and you might come across slightly different styles or symbols depending on the context. The key is finding an approach that works for you and clearly tells your family’s story.
If you’re looking for a simple tool to get started, I’ve been using the FamilyAxis Genogram Tool—it’s free, online, and really user-friendly.
So don’t stress if it takes a few tries to get it right. Genograms are meant to help us make sense of complex relationships, not complicate them even more. Take your time, play around with the format, and most of all—make it your own.
Sources:
Boardmix. (2024). Genogram Example Explained: Unlocking Family Dynamics. Retrieved from https://boardmix.com/articles/genogram-example/Boardmix
Verywell Mind. (2022, February 14). What Is a Genogram? Retrieved from https://www.verywellmind.com/what-is-a-genogram-5217739