

Family Axis SoftwareIntroducing Our New Observation Feature

Discover how FamilyAxis’s new Observations feature is designed specifically for family assessment centres to simplify logging, sorting, and analysing observations. Learn about its intuitive six-step grading system, customisable categories tailored to your assessment framework, and powerful analytics dashboards that help teams identify trends and intervene early.
Logging detailed observations is essential for family assessments — but many centres struggle with disorganised notes, missing categories, or tools that just aren’t built for this type of work.
Our new Observations feature in FamilyAxis solves these problems by bringing all your notes into one easy-to-use, searchable, and analysable dashboard.
Why Observations Matter — And What’s Holding You Back
Creating observations in family assessment centres can be tricky:
- Notes get scattered across different systems or paper files
- Existing children’s home software isn’t tailored to family assessments
- Assessment categories don’t match the frameworks you use
Because of this, important details can be lost, trends missed, and reporting becomes time-consuming. We designed the Observations feature to tackle these challenges head-on.
What You’ll Love About Observations
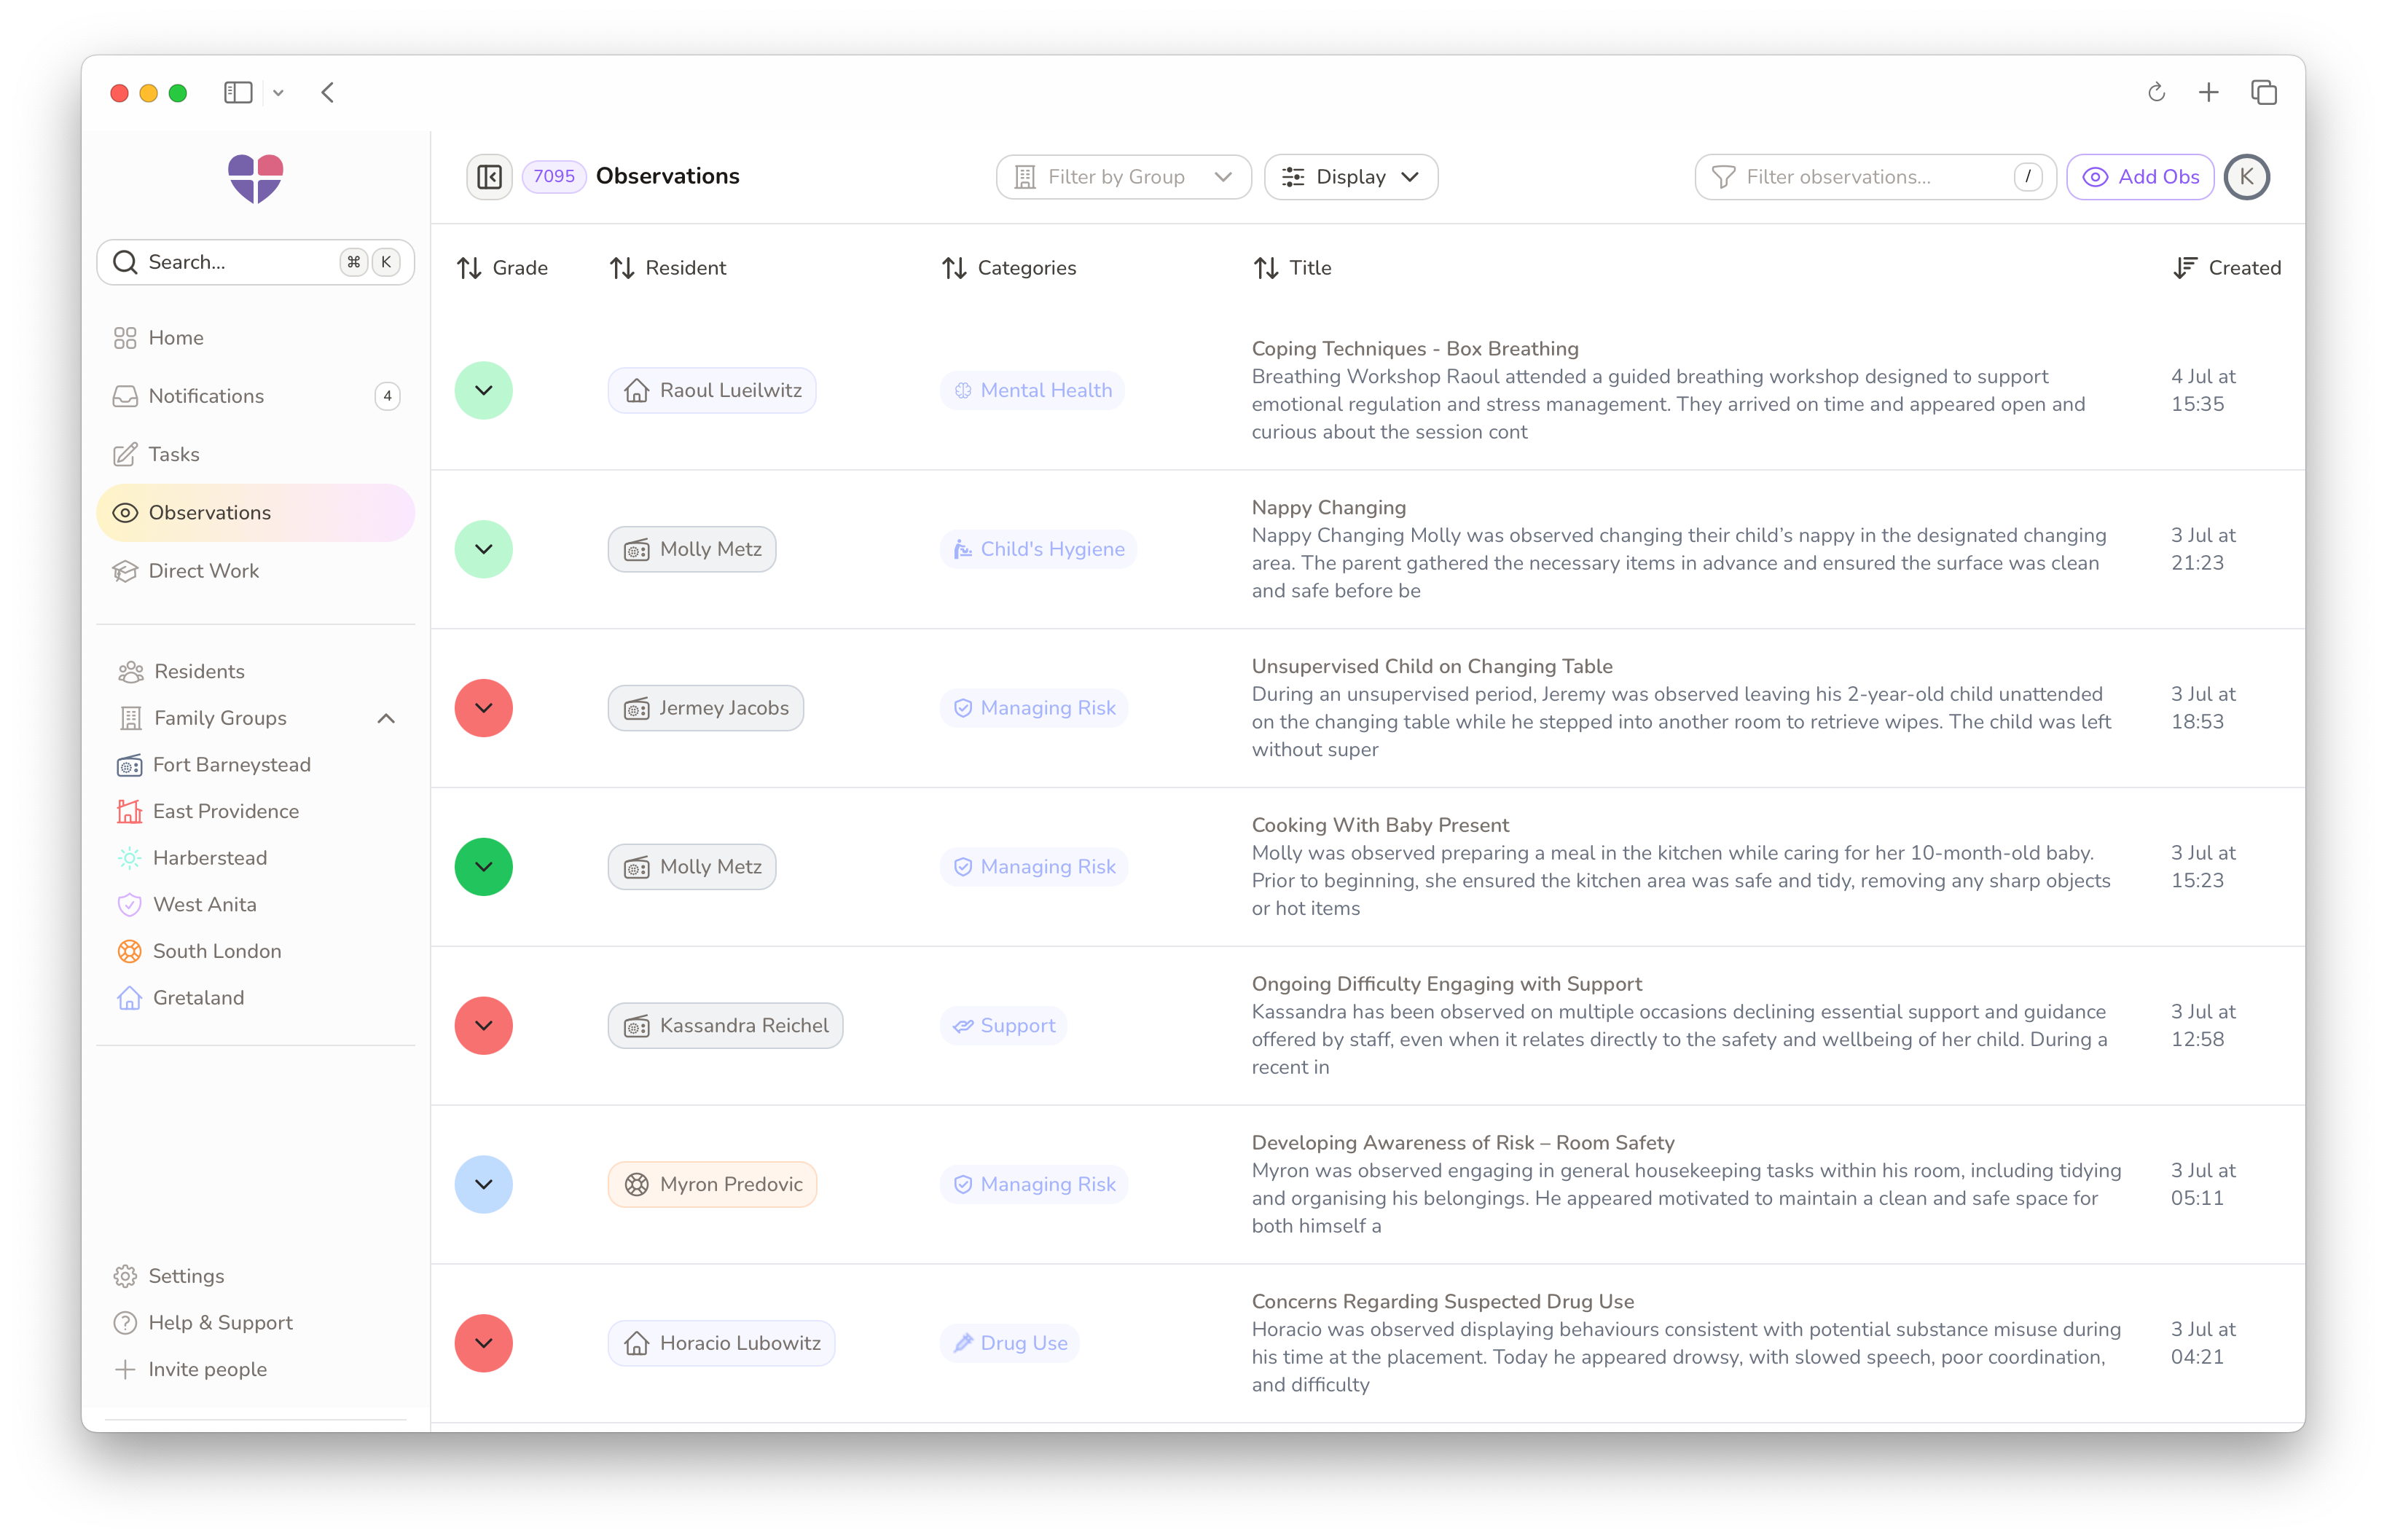
One Central Dashboard
View all observations for your entire centre or organisation in one place. Filter by home, resident, category, or date to find exactly what you need — no more hunting through spreadsheets or folders.
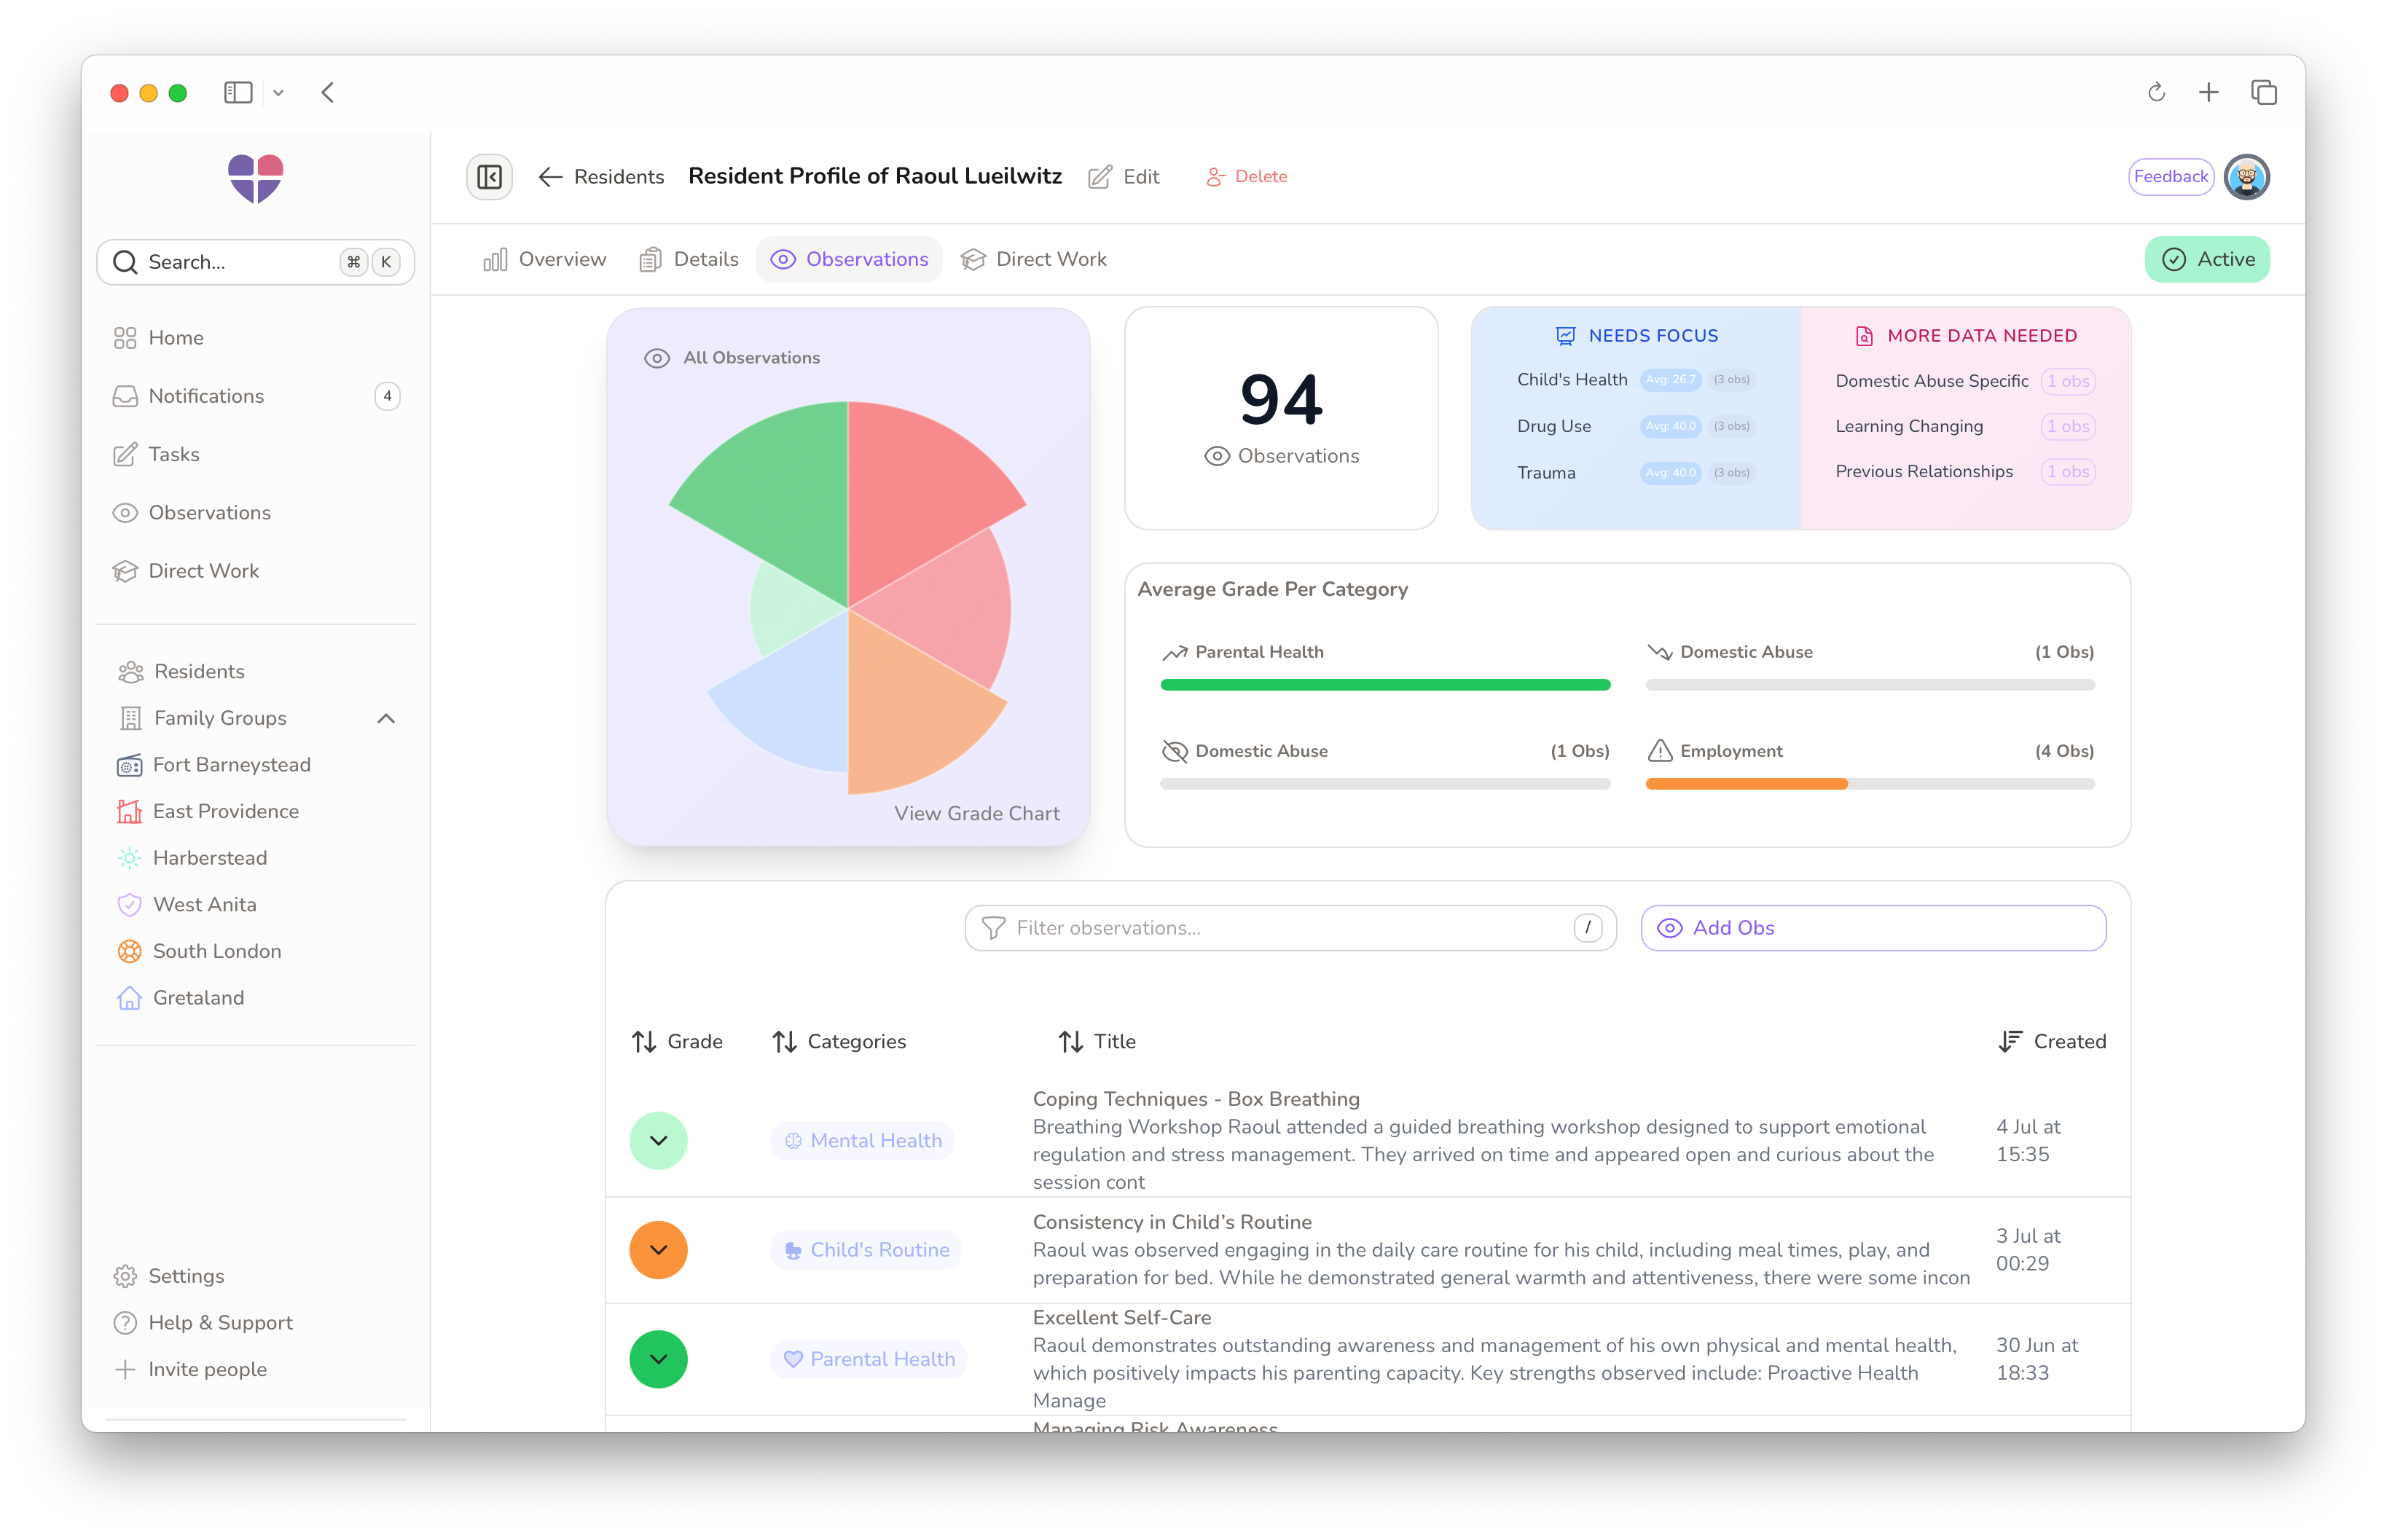
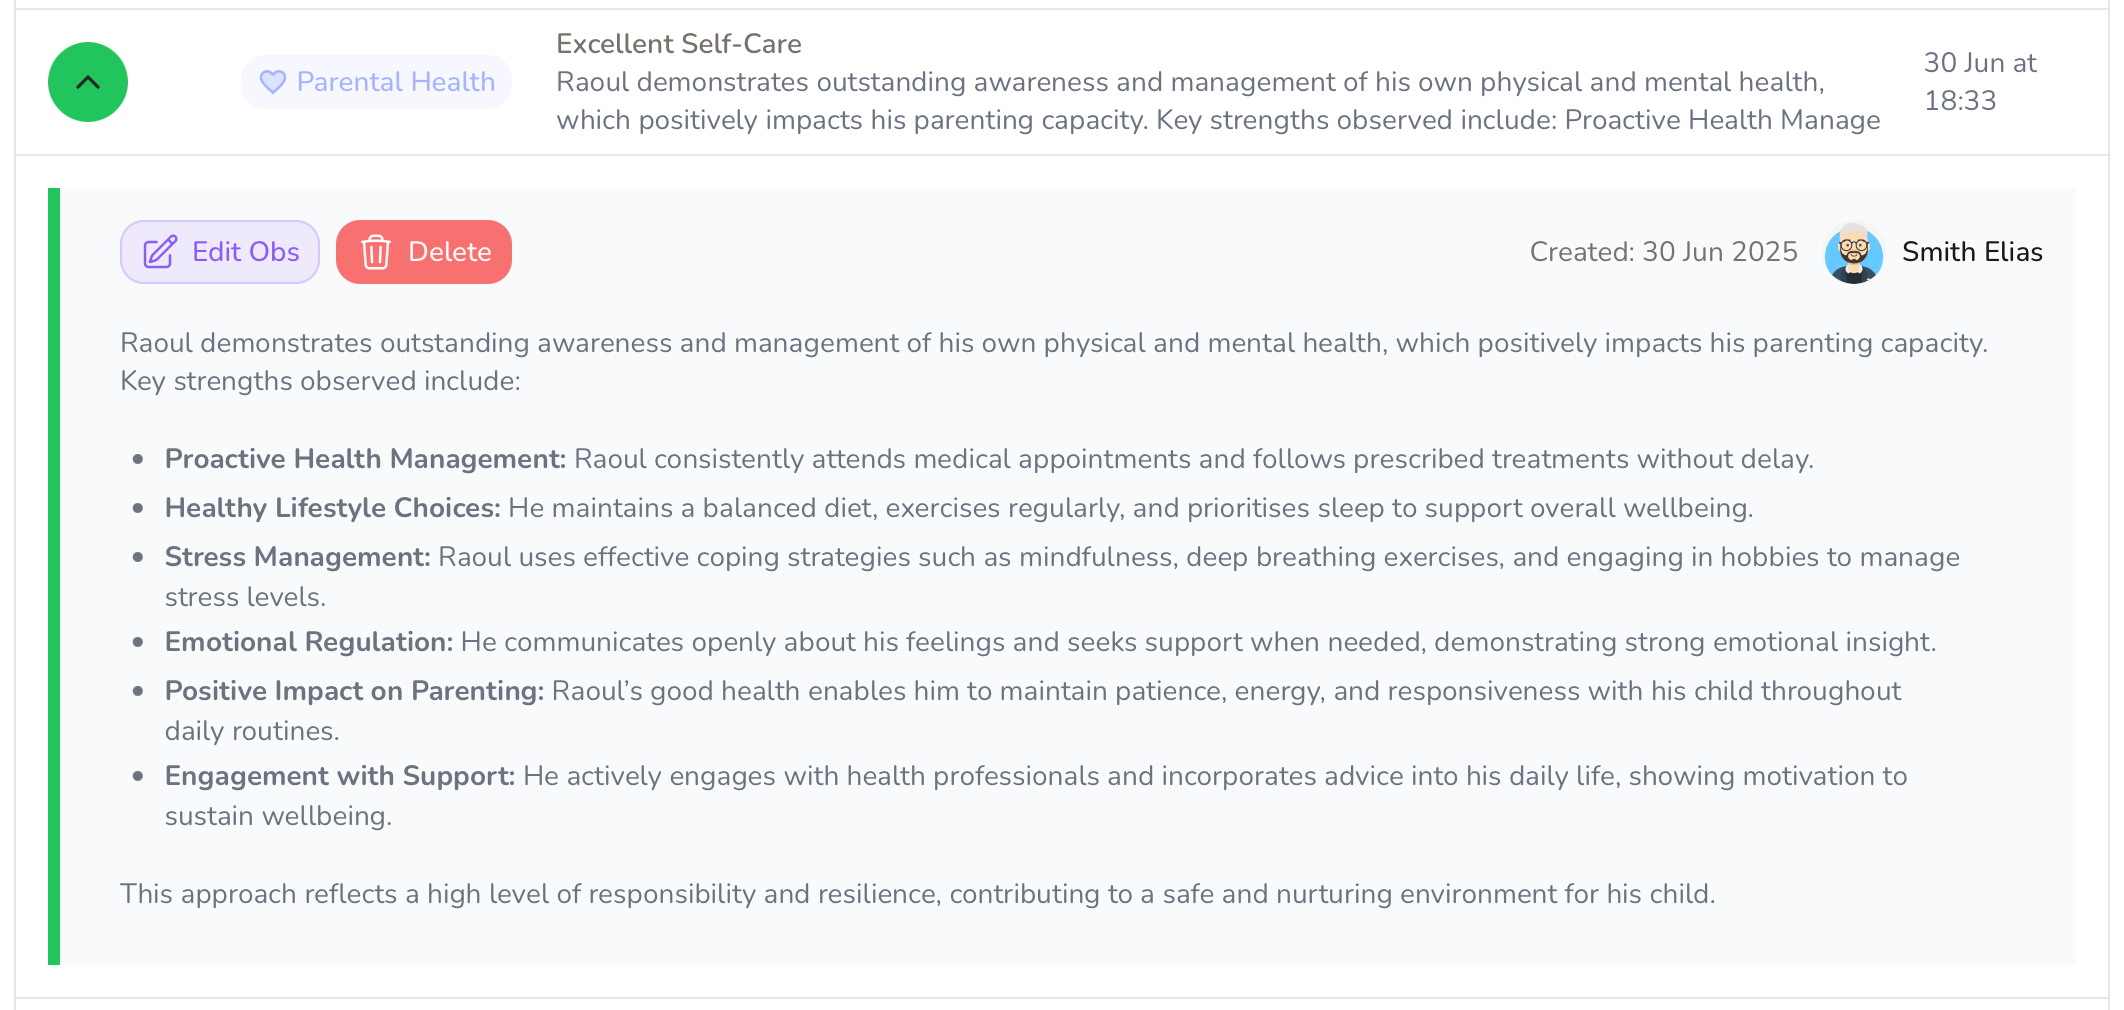
Individual Resident Profile
Switch to a resident’s profile to see just their observations. Sort, preview, and add notes easily, keeping each child’s story clear and organised.
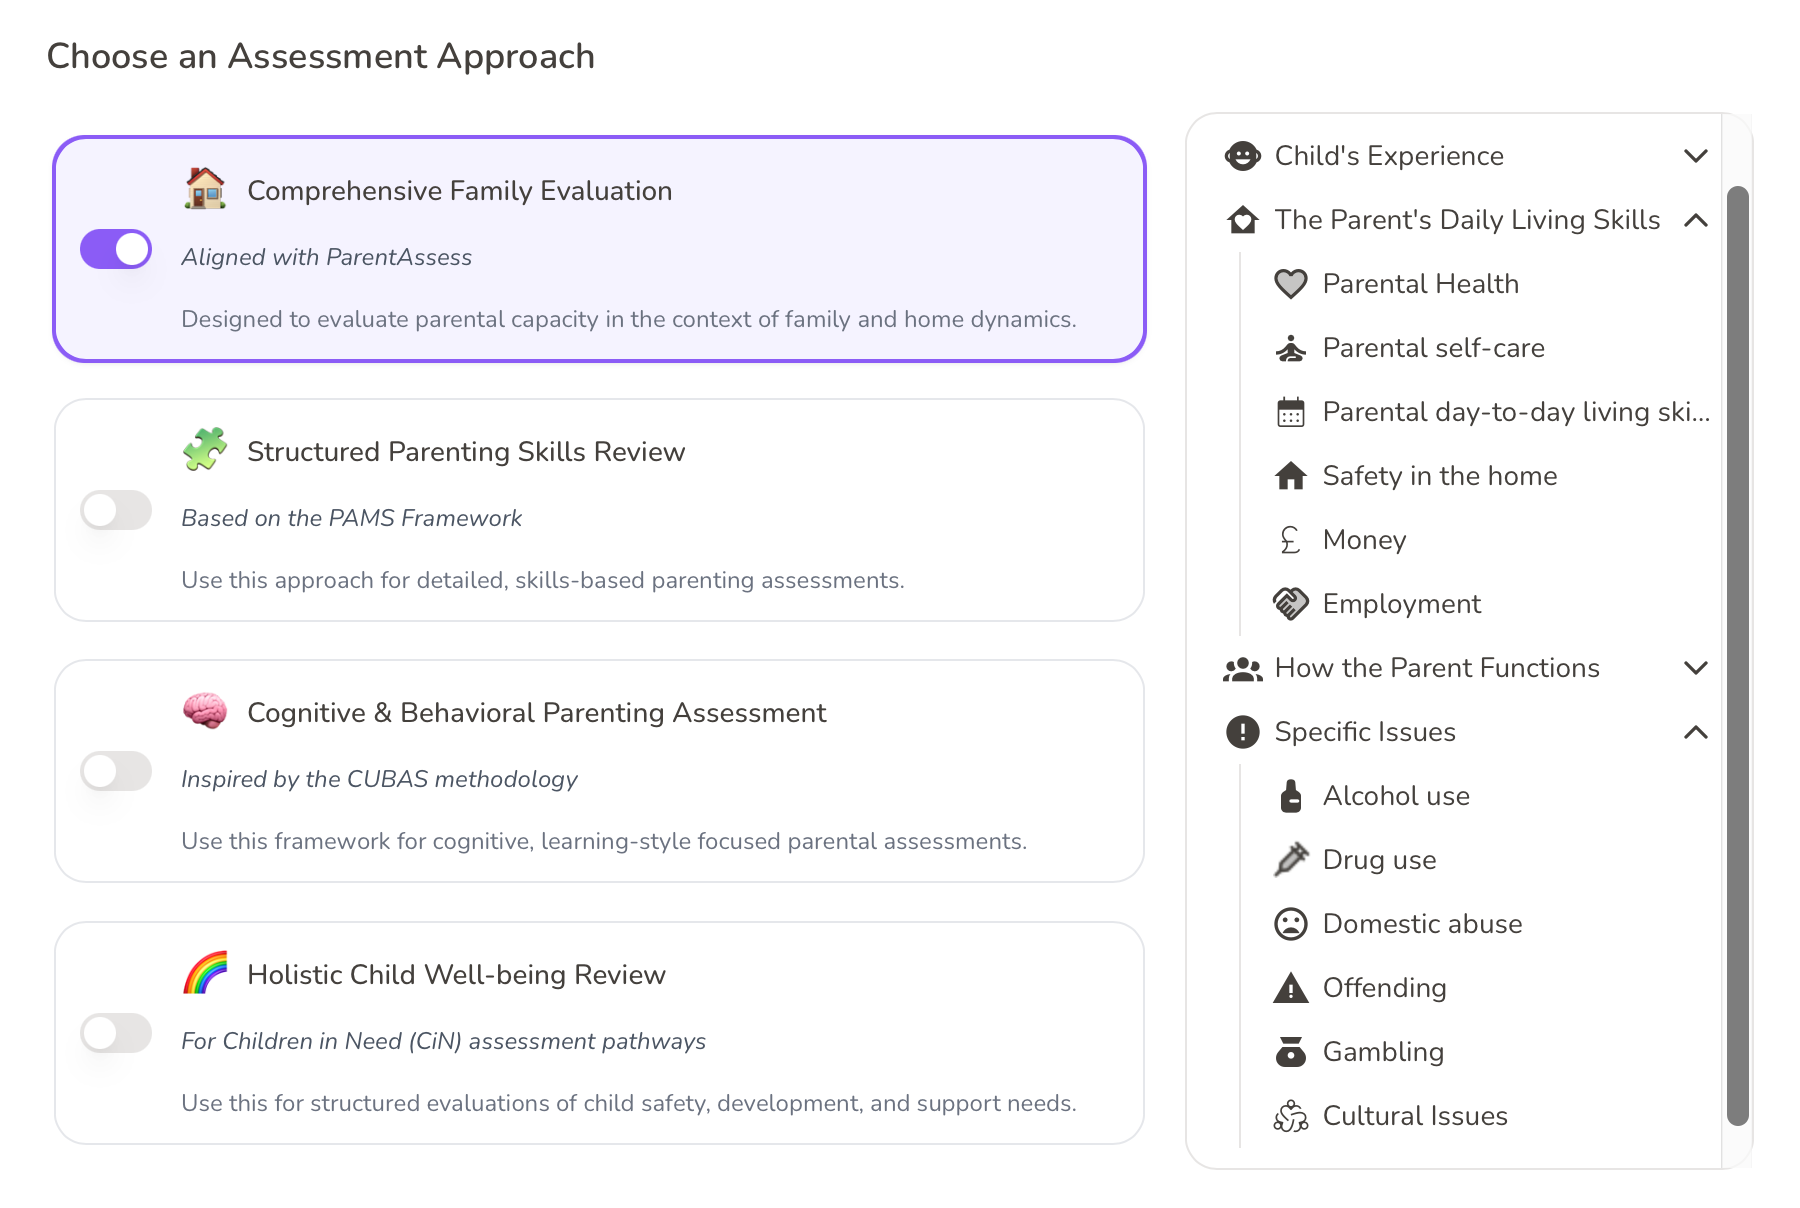
Categories for Your Framework
Choose the categories that align with the assessment framework your service uses. All key areas are available, so staff can confidently select the right category and sub-category for each observation.
The Six-Step Grading System
Each observation is rated on a six-level scale that helps staff quickly understand the significance of their notes.
This visual grading feeds into analytics so you can spot trends and intervene early.
Add and Edit Observations with Ease
Creating an observation is simple:
- Select the right category and sub-category (e.g., Child’s Experience > Feeding)
- Pick a grade from the six-step system
- Write your note using our rich text editor (bold, italics, bullet points, spellcheck)
- Give it a clear title so it’s easy to find later
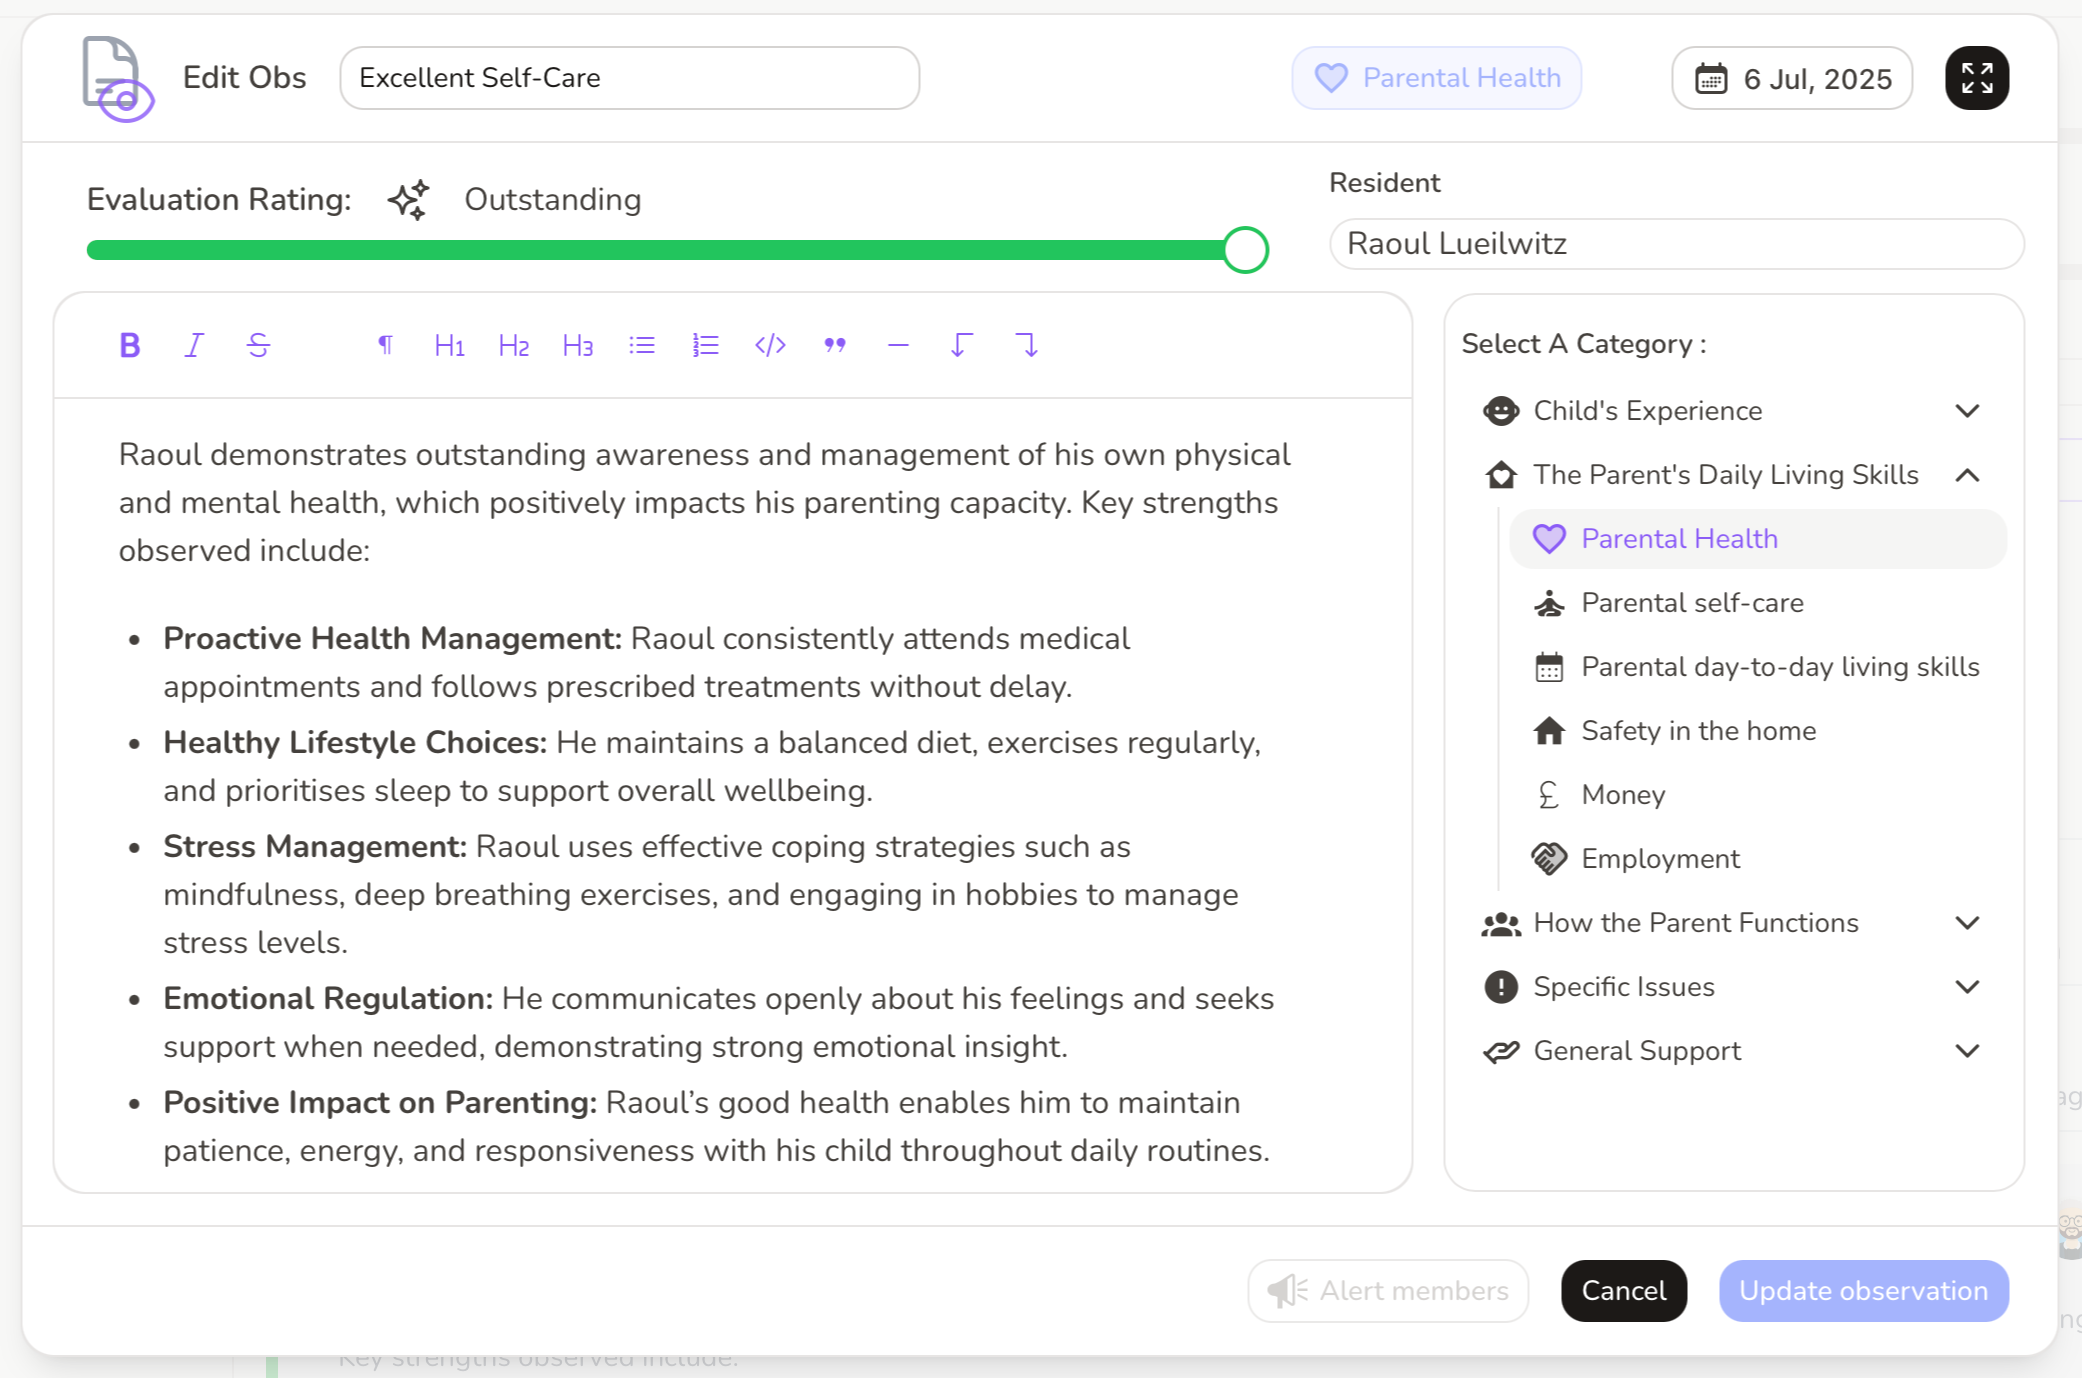
Made a mistake? No problem — you can edit any observation at any time.
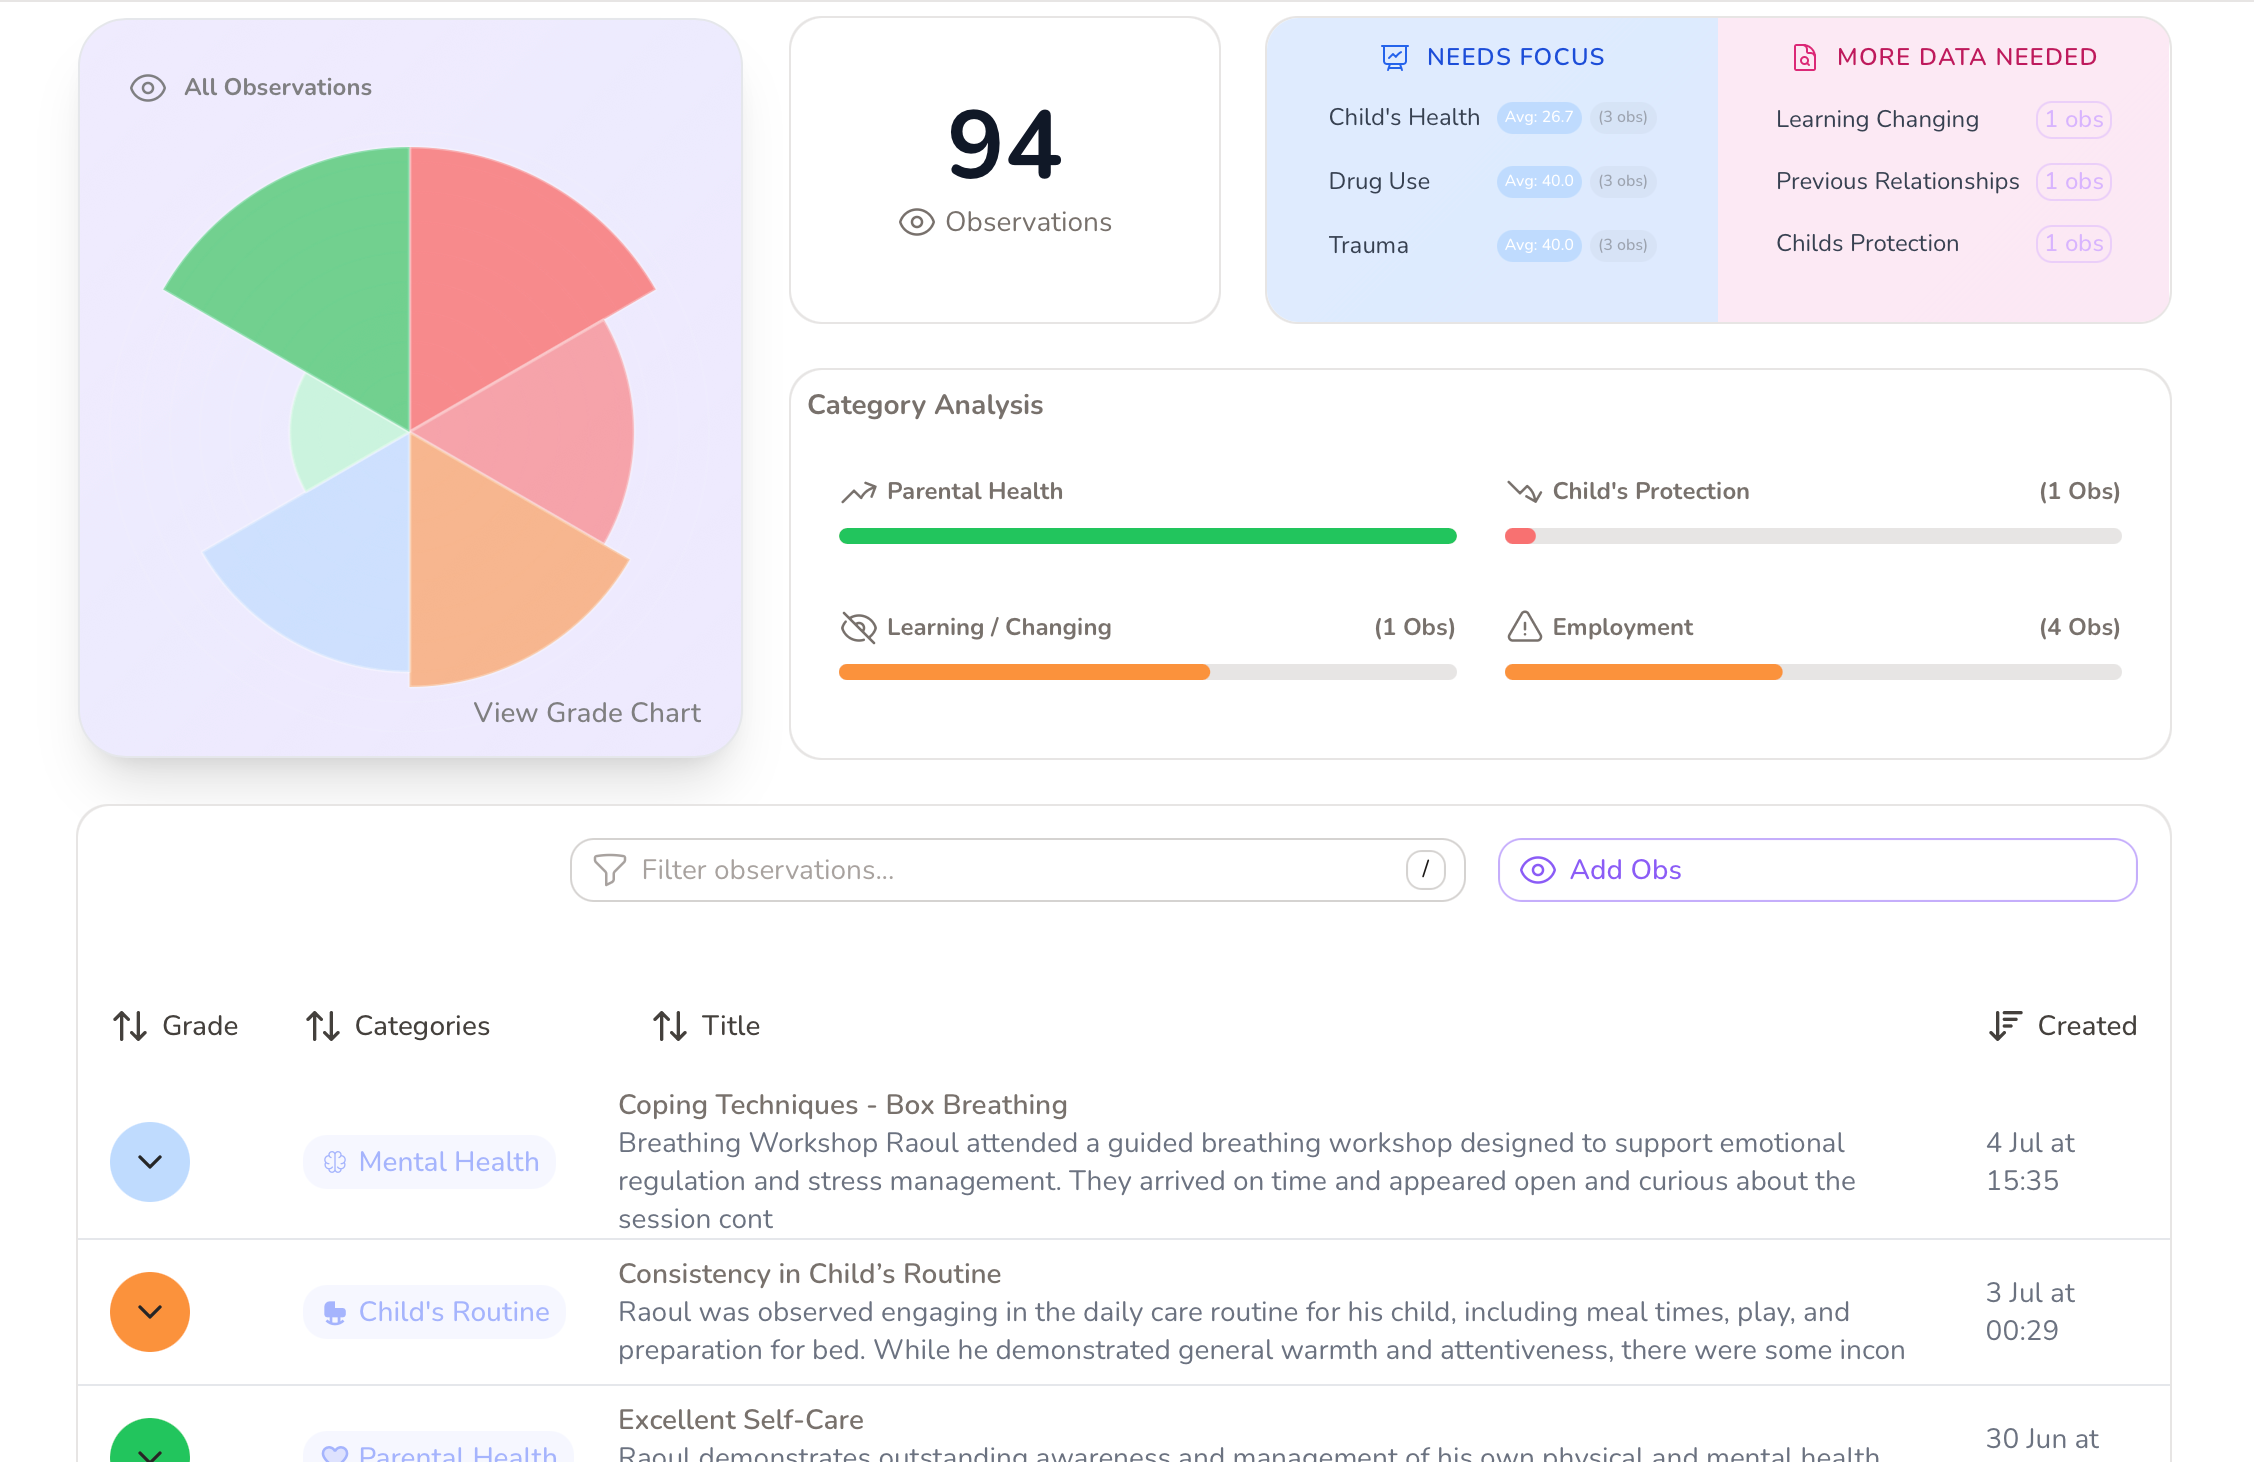
Powerful Analytics for Better Decision-Making
On the dashboard, you’ll see:
- Grading Pie Chart: Visualise how many observations fall into each grade.
- Category Insights: Identify your strongest areas and those needing focus.
- Category to Watch: Detect early warning signs with categories where scores are declining.
- Least Observed Categories: Spot areas with little recent data so staff can fill gaps.
This helps your team prioritise support and track progress effectively.
What’s Next?
For the time being, the Observations feature is in private preview. In the meantime, please ask questions or share your feedback about what you’ve seen here. Your input helps us make FamilyAxis even better.
Please subscribe to our mailing list, and we’ll keep you updated when features are finalised and share news of the launch.